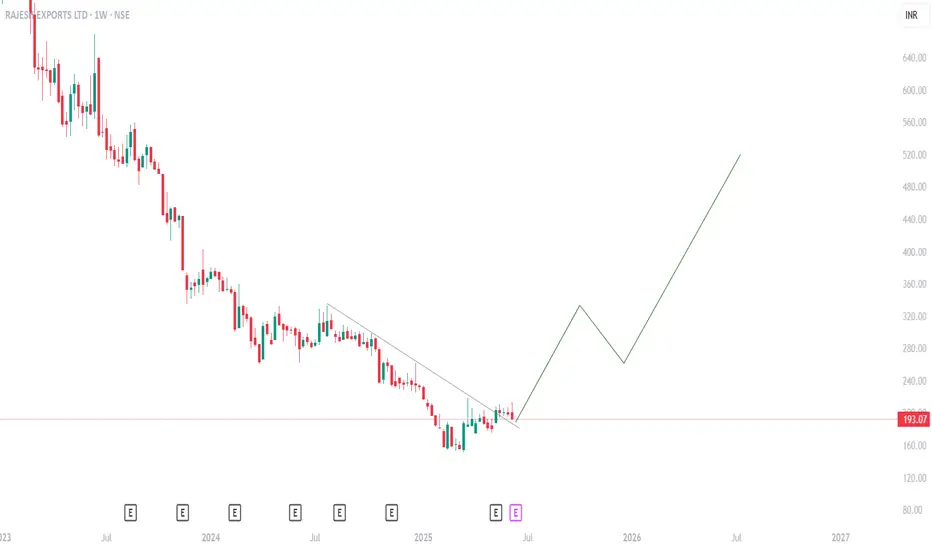
Can be 2x from hereBuy Rajesh exports cmp 197 target 330, 540
Promoter is buying from open market.
Available at dirt cheap price.
Let battery manufacturing kick start.
Any good new will lift the stock 350 levels quickly
RAJESHEXPO trade ideas
rajeshThe Indian jeweller was founded in 1989 by its current Executive Chair Rajesh Mehta.
The Mehta family controls 54.55% of the business, according to a statement on the company's website.

RAJESHEXPO Daily timeframe analysis for long term
NSE:RAJESHEXPO is previously given strong breakout and after that it is consolidating in a range.
Above 312 to 319 with SL of 302 .
Major targets are highlighted in Blue lines.

Charting the Future: An Elliott Wave ApproachTechnical Analysis of Rajesh Exports Using Elliott Wave Theory
Monthly Time Frame Analysis
Elliott Wave Count and Structure:
- The monthly chart of Rajesh Exports shows a clear Elliott Wave pattern, suggesting the completion of a corrective wave (C) of a larger degree wave ((2)) in Black, implying that a new bullish impulse is likely to begin wave ((3)) in Black.
- The recent price action indicates the end of Wave (C), part of a larger correction that followed a significant impulse wave (5) earlier of wave ((1)) in Black.
- This suggests that the stock is about to start a new bullish cycle, labeled as Wave (1) in Blue of a new impulse higher Primary degree wave ((3)) in Black.
Bullish Divergence:
MACD: The price shows hidden bullish divergence with the MACD, as the MACD line forms higher lows while the price makes lower lows on Monthly time frame.
RSI: Similar hidden bullish divergence is observed with the RSI too on monthly time frame, reinforcing the bullish outlook.
Daily Time Frame Analysis
Bullish Divergence:
MACD: The price shows bullish divergence with the MACD, with the MACD line forming higher lows while the price forms lower lows.
RSI: The RSI also shows bullish divergence, adding further weight to the bullish scenario.
Trigger Point:
Trendline Breakout:
The daily chart indicates a trendline breakout accompanied by a significant increase in volume. This breakout suggests a strong bullish sentiment and confirms the start of a new upward trend.
Invalidation Level:
The invalidation level for this bullish scenario is set at 261. If the price falls below this level, the bullish wave count would be invalidated.
Targets:
According to Elliott Wave Theory, the third wave (3) is typically the most powerful. Using the Fibonacci extension, the 161.8% target of Wave (1) places the possible price target near or above 1800.
Summary
Elliott Wave Count: Indicates a potential start of a new bullish impulse wave.
Bullish Divergence: Both MACD and RSI on the daily and monthly charts show bullish divergence.
Trendline Breakout: Confirmed with high volume, suggesting strong upward momentum.
Invalidation Level: 261
Target: 161.8% Fibonacci extension of Wave (1) projects a target near or above 1800.
The overall analysis suggests that Rajesh Exports is poised for a significant upward movement, with strong bullish indications from both the Elliott Wave counts and technical indicators.
I am not Sebi registered analyst.
My studies are for educational purpose only.
Please Consult your financial advisor before trading or investing.
I am not responsible for any kinds of your profits and your losses.
Most investors treat trading as a hobby because they have a full-time job doing something else.
However, If you treat trading like a business, it will pay you like a business.
If you treat like a hobby, hobbies don't pay, they cost you...!
Hope this post is helpful to community
Thanks
RK💕
Disclaimer and Risk Warning.
The analysis and discussion provided on in.tradingview.com is intended for educational purposes only and should not be relied upon for trading decisions. RK_Charts is not an investment adviser and the information provided here should not be taken as professional investment advice. Before buying or selling any investments, securities, or precious metals, it is recommended that you conduct your own due diligence. RK_Charts does not share in your profits and will not take responsibility for any losses you may incur. So Please Consult your financial advisor before trading or investing.

Rajesh export 50 Week low stock Rajesh export breakout in symmetrical triangle
50 week low
Under value stock.
Good technical trend.
This company have good business (gold mining and jewellery selling)
Fundamental is not good
My action ;
I am today bought 25% in my investment Amount .
Bought it for technical reason only and fundamental is not good.
It is long term stock and I am setting stop loss 5 %

Rajesh Exports - Live Market Update
Rajesh Exports is trading above yesterday's candle of 1-29-24 12:02 PM. Today's candles are
1-30-24 10:13 AM
1-30-24 2:39 PM
Let it stabilize above 10:13 candle and it will ensure upward movement.
Please apply 3 and 30 EMA. Let 3 EMA cut 30 EMA from below and it will become bullish in intraday. (Time Frame 1 hr.) Price targets have already been provided yesterday.
Stop loss just below 351.45.
Disclaimer: I am not a SEBI Registered Analyst. Please consult your advisor before making any decision.


Potential Multi-Bagger - Rajesh ExportsRajesh exports has broken a strong support. Probably, stop losses have hit of people, busniess is doing as good as it was doing for last 5-8 years. Its just time that this stock can become multi-bagger.
Either it will reverse from here or drop till 200 and then reverse. Unless, there is something wrong within the company that the retail investor has no clue of.
Disclaimer: This is my view on Rajesh Exports. I am not a financial advisor. Please trade at your own risk.

RAJESHEXPO : Adding onto the positionPrice is ranging in a key level as per technicals. So as mentioned in the previous post regarding this stock, I'm adding onto the position summing up my total holding in the scrip to 1.25% of the total capital. There is an upside potential of nearly 163% from the current average levels to all time highs.
Will consider adding on another 1.25% in the next 2 key support levels based on the future price action, if the price falls further. The macro and micro economics at that time will also be considered before acting on my technical conviction.
Will update underneath this post when I take any more action on the stock.

Rajesh export near to demand zoneAs you see price after long time reached demand zone. Area marked should be your watching time. Any reversal candle formation on demand will give us opportunity to grab. Keep on watchlist and do proper analysis concerned with your financial adviser before making any investments decision.

Multiyear Break Down After a strong uptrend from 2001 finally Top near 2016 and then price consolidate from last 8 years and finally break down its major support .

RAJESHEXPO : A potential multibaggerCompany Overview:
This company stands as a global leader in the gold industry, with a unique presence throughout the entire gold value chain, from refining to retailing.
Remarkably, it processes a substantial 35% of the world's gold production and serves as the largest exporter of gold products from India.
The company's operational and research and development facilities are based in Bangalore, India, while its main refining facility is located in Balerna, Switzerland.
Notably, it maintains an extensive design portfolio with 29,000 active jewelry designs, distributed through wholesale and retail channels.
Financial Strength and Valuation:
The company's financial performance is above average, which has led to an average valuation.
Despite a decline in the Rajesh Exports share price over the year, the earnings per share (EPS) has actually improved.
The past growth expectations may have been overly optimistic, and it's essential to acknowledge that the company is nearly debt-free.
Risk Factors:
The primary risk factor lies in the cyclical nature of the gold business.
Accounting-related concerns occasionally arise without comprehensive clarification from the promoters.
Being export-oriented, the company is susceptible to global market and export-related issues that can impact its business.
Stakeholder Interests:
Foreign Institutional Investors (FIIs) and Domestic Institutional Investors (DIIs) hold a significant stake in the company, with FIIs owning 15.38% and DIIs holding 10.98%.
Promoters demonstrate confidence by maintaining a 54.05% holding, while the remaining 19.49% is in the hands of retailers.
Over the past two quarters, FIIs reduced their stake from 17.60% to 15.38%, and DIIs from 11.18% to 10.98%, which may have contributed to recent stock price fluctuations.
Technical Analysis:
From a technical perspective, the stock is at attractive buying levels, given its position at the lower end of the channel.
Historical price action suggests a probable consolidation pattern forming on the weekly time frame before a potential move towards the channel's upper boundary.
The plan is to monitor this pattern in the coming weeks to consider additional position adjustments.
Investment Strategy:
Considering the overall assessment, there is potential for this stock to become a multi-bagger. However, it's vital to acknowledge associated risks.
An initial position of approximately 0.625% of capital has been taken, with the possibility of adding more in the future based on technical or fundamental conviction.
In summary, Rajesh Exports' unique position in the gold industry, coupled with strong financials, makes it an appealing investment. However, investors should be mindful of inherent risks and stay vigilant while considering future adjustments to their positions.

RAJESH EXPO SRONG UPSIDE..!!Rajeshexpo stock has created a breakout and rsi divergence with strong volume
expected target 20% and 45%
recomended use MTF
Happy trade...

Target for Rajesh Exports
Awesome financials and fundamentals of Rajesh Exports.
Two targets of 35% and 48% from CMP.

RAJESH EXPORTSRajesh Exports Ltd is a manufacturer of Gold and Gold Products.
Company is almost debt free.
Stock is trading at 1.06 times its book value.
its has formed bottom.
but its balance sheet is good giving proper year on year profit.
considering abt technical chart price is below 200 day,50day, 20day moving averages.
perfect time to buy AS MUCH INCREASE IN VOLUME AS WELL IN LAST FEW MONTHS.
RECENTLY BREAKOUT SEEN AS WELL.
CURRENTLY ITS ON 540
TECHNICAL TARGETS WILL BE T1- 620 T2-660
FINAL LONG TERM TARGET NEAR TO ALLTIME HIGH WILL BE T3-940
one shuld keep patients till final outcomes!!!!

Rajesh Export LtdRajesh Export Looking like strong come back waiting for Q1 result if result is good than stock is back strongly 1000 rs

Rajesh export at major supportEntry at 510 to 525
Target 730
Next average at 442
Company is fundamentally strong with QoQ profit growth
99% chance of reversal from this support.

Rajesh Exports Trend AnalysisDeeply undervalued mid cap gem with strong fundamentals.
Is setting up 5 GWh factory to manufacture Lithium Ion Batteries.
Technically RSI is showing weak bullish divergence on daily TF.
Currently price is hovering around 2015 levels whereas revenue increased more than 6 times and profit just doubled due to reduced profit margins.
With increasing number of retail outlets and Lithium Batteries production, OPM is definitely going to increase in couple of years. In this case expecting multibagger returns would not be wrong.
Chart is forming I-II, 1-2 pattern, means 3rd primary wave (wave 3) of the 3rd cyclic wave (wave III) will begin and in this case it is expected to be extended upto a minimum of 1.618 fib extension.
The above said pattern will become invalid if price goes below 518.50 where you can set stop loss (optional).
It is the best time to buy for the following targets:
Short term swing target @ 1000 (84% ROI)
Mid term positional target @ 1950 (259% ROI)
Long term positional target @ 2450 (351% ROI)
Do your own due diligence before taking any action.
Peace!!


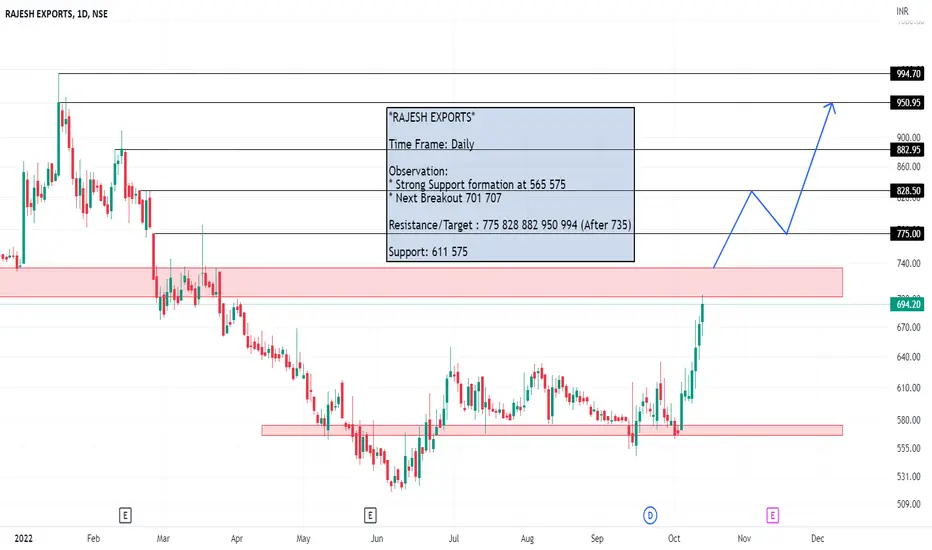
RAJESH EXPORTS Swing High Break*RAJESH EXPORTS*
Time Frame: Daily
Observation:
* Strong Support formation at 565 575
* Swing High Break
* Next Breakout 701 707
Resistance/Target : 775 828 882 950 994 (After 735)
Support: 611 575
RAJESH EXPORT LONG ENTRY RAJESH EXPORT LOOK GOOD FOR SMALL upside
TRIANGLE PATTERN BREAKOUT POSSIBLE
BUY ABOVE 640
SL 600
TGT 680 705 720
Ask your financial advisor before taking any action based on my view
Only for educational purposes

Rajesh Exports BreakoutThe stock has broken out and retested, therefore may undergo a reversal rally. Trade is supported by Supports Nearby.
Risk Reward Ratio - 2:1
SL is placed below the support zone & the lower trendline. The target is placed near resistance.

RAJESHEXPONSE:RAJESHEXPO
please note that we are not a SEBI Registered Investor Adviser/PMS/ Broking House.
All the contents over here are for educational purposes only and are not investment advice or recommendations
offered to any person(s) with respect to the purchase or sale of the stocks / futures and options.
You are also requested to apply your prudence and consult your advisers in case you choose to act on
any such content available as WE claims no responsibilities for any of your actions or any outcome of
such action
