RAMKY trade ideas
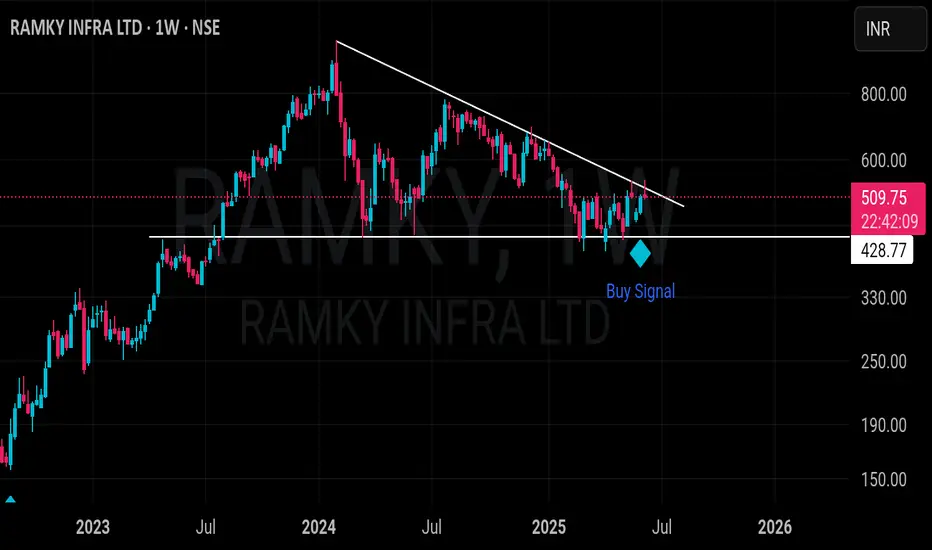
RAMKAY INFRA technical analysis Ramky Infrastructure Ltd. (NSE: RAMKY) is currently trading at INR 510. The company operates in the engineering and infrastructure development sector, specializing in environmental services, real estate, and industrial projects across India.
Key Levels
Support Levels: INR 312.90, INR 461.70, INR 545.45
Swing Level: INR 634.05
Possible Upside Levels: INR 949.60, INR 1,098.40, INR 1,287.95
Technical Indicators
RSI: The Relative Strength Index (RSI) is at 50.03, indicating neutral momentum, meaning the stock is balanced without strong bullish or bearish pressure.
Volume: Trading volume has been stable, reflecting consistent investor interest. A surge in volume at resistance levels could confirm a breakout toward higher price points.
Sector and Market Context
Ramky Infrastructure Ltd. operates in India’s construction and infrastructure sector, benefiting from government-backed urban development projects, road construction initiatives, and smart city planning. The sector has seen strong demand growth, bolstered by budget allocations for capital expenditures and private sector participation in infrastructure financing. However, fluctuations in construction material costs, regulatory approvals, and financial structuring remain key risk factors. Investors continue to monitor India’s infrastructure investment trends, which provide long-term stability but are subject to economic cycles.
Latest News and Developments
Market Trends: Strong institutional interest in construction and infrastructure stocks, driven by India’s focus on urban expansion.
Analyst Ratings: Recent reports suggest positive earnings growth, backed by new project acquisitions and improved execution timelines.
Quarterly Results: The company reported consistent revenue and stable profit margins, despite higher operational costs.
Dividend Update: The firm has declared a dividend of ₹6 per share, reinforcing investor confidence in its financial stability.
Analysis Summary
Ramky Infrastructure Ltd. presents a stable technical setup, with RSI reflecting neutral positioning and price movement near key levels. Volume trends suggest continued investor engagement, while sector-wide expansion supports long-term growth potential. Investors should monitor price action at resistance levels, upcoming project approvals, and broader economic indicators before making investment decisions. A cautious but strategic approach is advisable, considering market volatility and cyclical industry risks

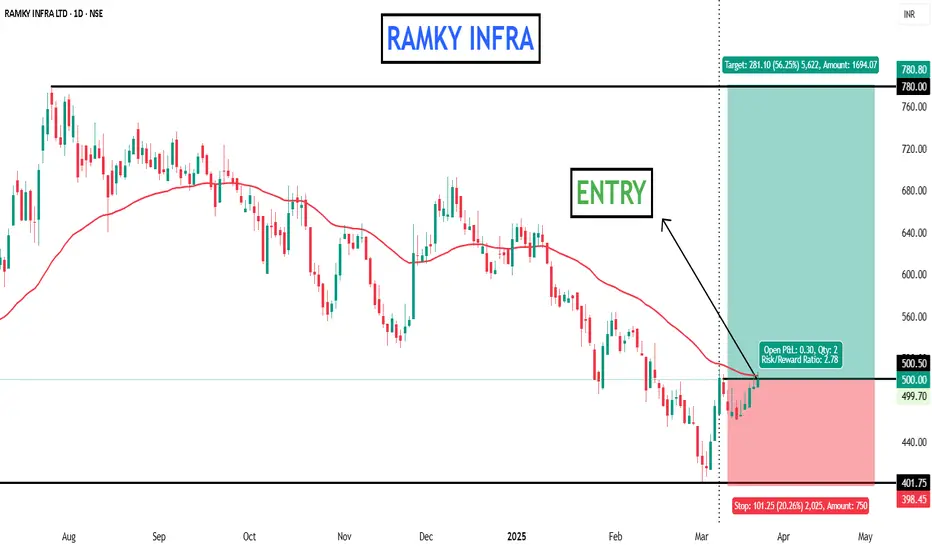
FIRST ENTRY INITIATED - RAMKY INFRA LTDEverything is pretty much explained in the picture itself.
I am Abhishek Srivastava | SEBI-Certified Research and Equity Derivative Analyst from Delhi with 4+ years of experience.
I focus on simplifying equity markets through technical analysis. On Trading View, I share easy-to-understand insights to help traders and investors make better decisions.
Kindly check my older shared stock results on my profile to make a firm decision to invest in this.
For any query kindly dm.
Thank you and invest wisely.
RAMKY gives brake out on daily chart.NSE:RAMKY
RAMKY gives brake out on daily chart.
I am buying this stock
Near 700-710
And follow sl on 550
My target will be 950
My risk reward ratio is 1:1.50
Return on capital 35%

positional idea with pros and consPros
-Prior uptrend
-Weekly Base
-reduced debt
-Huge volumes on green days
-Tight consolidation of 5 weeks in base
-Low vol in base formation
-Above 40 WEMA
Cons:
-Overhead supply
-Low RS

Long setup in Ramky InfraTargets are Big as shown in the chart..
Short term trader can buy with SL of 80 and long term investors go with SL below 60 on WCB
I am not a full time analyst, I just post my ideas only to help others. Remember it is your capital and R&R always


13 years breakout 13-year breakout with huge volume followed by weekly follow-up and having a good order book which is twice the market cap. Weekly followup shows strength in the stock.

Resistance BreakoutPlease look into the chart for a detailed understanding.
Consider these for short-term & swing trades with 2% profit.
For BTST trades consider booking
target for 1% - 2%
For long-term trades look out for resistance drawn above closing.
Please consider these ideas for educational purpose

Ramky Infrastructure-Nice BreakoutRamky Infrastructure-Nice Breakout
Capital to be deployed- 20k
Investing Price -407-409
Breakout Price -407
Stoploss -345
Targets -749
#ramky #StocksToBuy #StocksInFocus #StockMarket #stockstowatch #StocksToTrade


Multi Year Breakout Multi year Breakout accomplished by sucessful retest of the stock ..
Pattern obeserved : Cup and handle
Pattern - Success rate High
Reliable pattern with spike in volumes
Cmp 319
TGT 395-480+
Sl - 295 for short term with 250 for long term
Note : Already invested so do your own research and analysis before investing .. you are responsible for your own profits or loss .. Analysis for education purpose only


Base on Base formation with VCPBase on Base formation
VCP on 1 hour timeframe as well.
Inisde day candle.
Volume dry up on supply.
Pivot buy at 239.5
Tight SL at 227
Publishing for my own referene. Not an investment advise.

Ramky Infra- bulls Enter-Chart has became technically strong by breaking the december trendline. Accumlate between 190-210 with ths stoploss of 170 for TGT 215-240-260.
