Rate Gain Travel Technologies Ltd view for Intraday 27th May #RARate Gain Travel Technologies Ltd view for Intraday 27th May #RATEGAIN
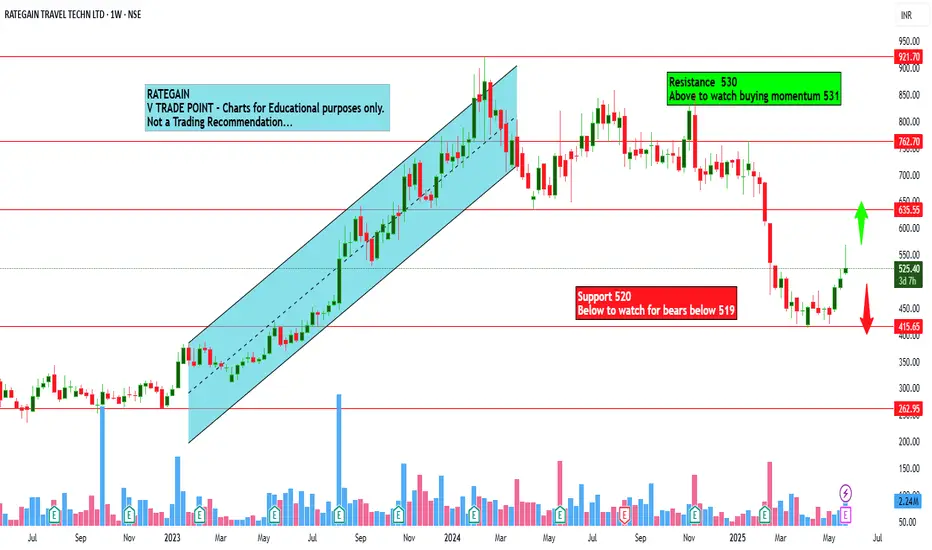
Resistance 530 Watching above 531 for upside momentum.
Support area 520 Below 525 ignoring upside momentum for intraday
Watching below 519 for downside movement...
Above 525 ignoring downside move for intraday
Charts for Educational purposes only.
Please follow strict stop loss and risk reward if you follow the level.
Thanks,
V Trade Point
RATEGAIN trade ideas
Rate gain: Techno funda pick RateGain Travel Technologies Ltd is the leading distribution technology company globally and the largest Software as a Service (SaaS) provider in the travel and hospitality industry in India. The firm offers travel and hospitality services across different verticals like hotels, airlines, online travel agents, meta-search companies, package providers, car rentals, cruises, and ferries.
technically trading at prior support areas !

low valuation IT stock have lower valuation; im not talk about the PE ratio; im talking on other valuation parameters like LTV/CAC
1. **Rounding Bottom Pattern (📈➡️)**:
The chart shows a rounding bottom pattern, indicating a gradual reversal from a downtrend to an uptrend. This is generally a **bullish** pattern. 📊✨
2. **Trend Line and Consolidation (🔻📉)**:
A downward sloping **trend line** is visible after the peak, indicating some correction or consolidation. This shows **resistance** at higher levels. ⚠️🔎
3. **Support Levels (📉📊)**:
There's a **base level** of support around ₹642 and a lower major support near ₹526. These act as **key levels** to watch for price action. 🛠️📉
4. **Volume Analysis (🔊📊)**:
- **Volume** seems low in certain areas compared to the **rising price**, which might suggest weaker participation. High volume during breakouts will be key. 📉📢
5. **Valuation Comment (📉📊)**:
"Very low valuation compared to peers” could hint at potential opportunities but requires careful analysis. 💹🤔
6. **Neutral Recommendation (🛑)**:
The chart explicitly mentions **no recommendation** for buying or selling. Likely suggesting a **wait-and-watch** approach. 🕰️👀
**Overall sentiment**:
⚖️ Neutral with potential for bullish or bearish moves depending on breakouts or breakdowns around key levels.

rategain with an upside of 20%at a good support with calculated averageing strategy to make good gains. stock is performing good, can give a good return

Rate Gain looking goodRate Gain looking good. It has taken support at 200 D EMA and likely to reverse from here.
My idea is only for educational purpose

Short Term Bullish ViewShort Term Bullish View on Rategain
Educational Purpose only
2 Months Duration - 35% Upside


RateGain Assending Triangle Breakout Rate Gain:
Support: 425
Resistance: 455
In trading, a triangle breakout refers to a technical analysis pattern where the price of an asset breaks out of a triangular consolidation phase. Triangles are chart patterns formed by converging trendlines that indicate a period of decreasing price volatility as the asset's price moves within a contracting range. When the price eventually breaks out of this pattern, it can signal a significant move in one direction, providing valuable information to traders and investors. Here are the key significances of a triangle breakout in trading:
1. **Potential Trend Reversal or Continuation:** Triangle breakouts can indicate either a potential reversal of the current trend or a continuation of the existing trend. A breakout to the upside suggests a bullish continuation, while a breakout to the downside suggests a bearish continuation. However, it's essential to consider the context of the triangle in the larger price trend of the asset.
2. **Timing Market Entry:** Traders often use triangle breakouts to time their entry into a trade. Once a clear breakout occurs and is confirmed (usually by significant volume and price movement beyond the breakout point), traders may take positions in the direction of the breakout. This can help them catch a substantial portion of the ensuing price move.
3. **Price Targets:** Traders can use the height of the triangle to estimate a potential price target for the asset after the breakout. By measuring the distance between the highest and lowest points of the triangle and adding that distance to the breakout point (for an upside breakout) or subtracting it (for a downside breakout), they can get a rough target for the price move.
4. **Confirmation of Market Sentiment:** A triangle breakout can act as a confirmation of the prevailing market sentiment. If the asset was trading in a tight range, the breakout can show that market participants have made a decisive move in one direction, indicating their confidence in that trend.
5. **Volume Confirmation:** For a triangle breakout to be more reliable, it is essential to have a noticeable increase in trading volume accompanying the breakout. High trading volume during the breakout suggests stronger conviction among market participants, increasing the chances of the breakout leading to a meaningful price move.
6. **Reduced Uncertainty:** Triangles form during periods of uncertainty and indecision in the market. A breakout from the pattern resolves this uncertainty, providing traders with more clarity on the future direction of the asset's price.
7. **Trading Opportunities:** Triangles are common chart patterns and can be found across various time frames. Traders who specialize in chart pattern trading often actively seek these setups as they present potential trading opportunities with well-defined entry and exit points.
It's important to note that while triangle breakouts can be powerful signals, they are not foolproof. False breakouts can occur, where the price briefly moves beyond the triangle but then quickly reverses back into the pattern. To mitigate the risk of false signals, traders often use additional technical indicators and analysis to confirm the validity of the breakout before making trading decisions. Additionally, no trading strategy guarantees profits, so risk management and discipline are crucial when implementing triangle breakout trades or any other trading strategies.
⚠️ ⚠️⚠️It's My Study⚠️⚠️⚠️
Before taking any trade Please do your own research and analysis.
Disclaimer:
📌I am not a SEBI registered research analyst. Stock market tradings are
subject to market risk.
📌I will NOT be Responsible for your PROFIT or LOSS.
📌Please consult your financial advisor before taking any positions.

Rategain Travel Technologies LtdRateGain Travel Technologies Ltd is the leading distribution technology company globally and the largest Software as a Service (SaaS) provider in the travel and hospitality industry in India. The firm offers travel and hospitality services across different verticals like hotels, airlines, online travel agents, meta-search companies, package providers, car rentals, cruises, and ferries.

RAIT GAINCUP PATTERN BREAK out on this stock. wait for some retracement then buy. Gud volume on break out.

#rategain #RategainTravelTechnologiesGood round bottom formation
RSI divergence on daily may correct a bit
good to accumulate at 525-565 lvls
FII-DII increasing shareholding
YOY 196% net profit

RATEGAIN, GOOD TO ADD PARTIALLYRATEGAIN
Added in two batched Today
434 and now at 450.
Keeping SL 413
RISK is DEEP so safe can avoid and wait for retest.

Rategain TravelThe chart appears favorable on shorter timeframes, indicating a potential breakout at the significant Gann resistance level of approximately 591. After the candle rebounds from the 1/1 level, it is exhibiting a strong upward movement, with the initial target situated around 680.

BTST Trade Book 5%Rising Wedge Breakout in Rate Gain Travel
Book profits within the first 30 minutes of the market opening
- Try to exit by taking 5% profit of each trade
- SL can be taken when the 5/15 min candle closes below 44EMA
Now, why do I prefer swing trades? The primary reason is that I have observed that 90% of the stocks give most of the movement in just 3-4 days and the rest of the time they either consolidate or fall
CMP- 395
Target Price 415
Note:- I am not SEBI Registered This Trade is only educational Purpose

RateGain - Breaking out RateGain Technologies NSE:RATEGAIN is one of the largest SaaS provider in the travel & hospitality industry.
Breaking out with over 100% 50-Day RVOL in first two hours of the trading day.
Already a pocket pivot volume signal.
It is also an Easy Earnings Comparison (EEC) candidate, meaning it is expected to report very good earnings in the forthcoming quarter.

⭐️#RATEGAIN for a potential breakout !👉🏻Stock Trading above 20 & 50 EMA
👉🏻Price consolidating in a small base.
👉🏻Breakout above 420 Support 390
👉🏻RR Favorable for going long

RATEGAIN - Bullish ConsolidationNSE: RATEGAIN is closing with a bullish consolidation candle supported with volumes.
Today's volumes and candlestick formation indicates strong demand and stock should move to previous swing highs in the coming days.
The stock has been moving along the horizontal support for the past few days which is indicating demand.
One can look for a 8% to 12% gain on deployed capital in this swing trade.
The view is to be discarded in the event of the stock breaking previous swing low.
#NSEindia #Trading #StockMarketindia #Tradingview #SwingTrade

Rate Gain Clear Breakout on the chart A sequence of consolidation patterns in a stock may imply that it is preparing for a noteworthy movement, and if it is trading above important moving averages, it may indicate a robust bullish trend. Furthermore, breaking through the recent all-time high level is a distinct indication of the stock's upward momentum.
Just look at the volume on the chart.
It is essential to trade with prudence and thoughtfully analyze your risk management plan before executing any trades. Wishing you a successful trading experience!


Rate gain Rate gain
273- 281 it has already bottomed out
Day it crosses and stays above 316 its buy in truk load 316 is gann number
Play is to hold stock for 3 yrs it will reach eaily 1426 to 1009 level ;xD
invest and forget .
this be the bamboo tree ;xD
And look at share holding pattern

RATEGAIN NSE BULLISHVIEW ABOVE 400RATEGAIN NSE is bullish if 400 holds. New LifeTime High. Fresh Breakout. Newly Listed.
**** Educational Purpose Only. Not Buy/Sell Recommendation.
