REC LIMITED
REC Ltd (Rural Electrification Corporation Limited) is a distinguished public sector company in India that plays a pivotal role in the country's power sector. With a mission to promote and finance rural electrification projects across India, REC Ltd has made significant contributions to enhancing the quality of life in rural areas. The company offers an array of financial products and services that support the development of power infrastructure, thereby fostering economic growth and sustainability. Known for its robust financial performance, innovative solutions, and commitment to corporate social responsibility, REC Ltd stands as a beacon of progress and reliability in the energy sector.
Entry at-524.65
Breakout-536.90
Target 1-558.10
Target 2-584.20
Target 3-601.10
STOP LOSS-499.25
Disclaimer - All information on this page is for educational purposes only,
we are not SEBI Registered, Please consult a SEBI registered financial advisor for your financial matters before investing And taking any decision. We are not responsible for any profit/loss you made.
RECLTD trade ideas

$RECLTD 3.5R short ideaNSE:RECLTD 3.5R short idea
for educational purposes.
it could come back to get some liquidity and then try. it has already made a lower high. lets see

Buy Rural Electrification Short Term Trading Advice by Goodluck Capital
Buy Rural Electrification
Buy Range- 500 - 515
Target- 560 - 570
StopLoss- below 470
Potential Return- 10-12%
Approx trade duration 10 - 12 days

Bullish trade setup in REC LtdThere are 2 points to be noticed in the daily chart of REC Ltd
1. There was a breakout from the downtrend on 26th April
2. The resistance was broken on 2nd May but then we saw a selling pressure in the stock but the candle made today is a decent bullish candle and this could be a breakout as well.
Can buy for targets of 570 & 590.
Educational purpose only

REC LTD | Rural Electrification Corporation Limited ideaREC LTD | Rural Electrification Corporation Limited idea
REC Remain Bullish until remain in the Top Blue Band
above 520/- Next upcoming levels 634/670/810
Top we can expect 1317/1342
275/326 strong Support Levels

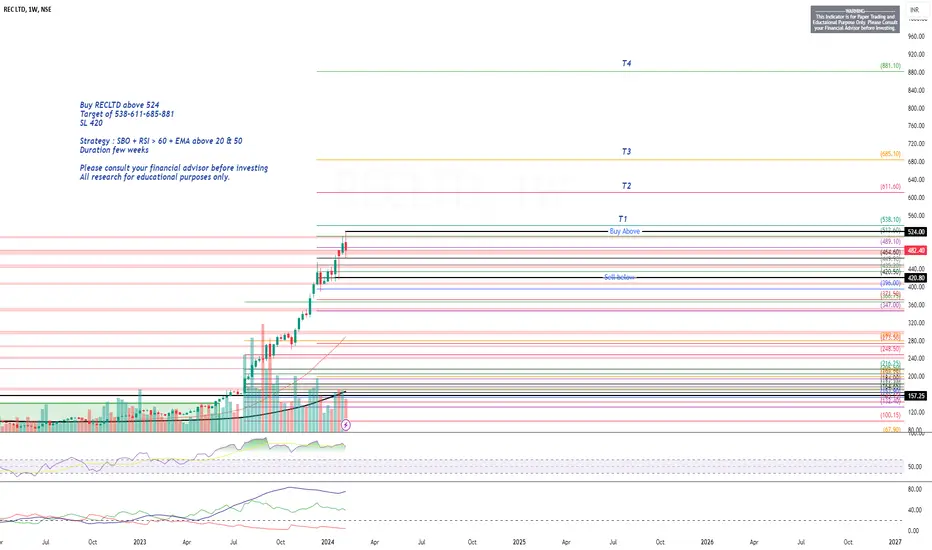
RECLTD Long PositionalBuy RECLTD above 524
Target of 538-611-685-881
SL 420
Strategy : SBO + RSI > 60 + EMA above 20 & 50
Duration few weeks
Please consult your financial advisor before investing
All research for educational purposes only.
REC ready for a flag breakoutA sector which has had a good rally in the past few months and looks good to go amidst the volatile markets during the election year.
A high dividend-yielding stock ready to break out of the flag pattern, REC looks good for short to medium-term.
Entry - 457
SL - 415
Target - 600+

RECLTD IS GREAT STOCK TO WATCH OUT FOR DOUBLE YOUR WEALTH *INVESTMENT Recommendation for REC Limited (RECLTD)**
**Current Price:** ₹457
**Stop Loss:** ₹388
**Long-term Target:** ₹850
**Technical Analysis:**
The price action of REC Limited (RECLTD) on the charts suggests a bullish outlook, following a breakout from a flag and pole formation, which is typically a continuation pattern. The breakout above the flag at around ₹430 adds to the bullish sentiment, indicating potential for an upward trajectory. The immediate resistance is viewed around the ₹500 mark. Once it clears that level, the path to higher targets like ₹850 becomes more plausible. Investors should consider maintaining a stop loss at ₹388 to mitigate downside risk.
**Fundamental Overview:**
REC Limited, a prominent player in the financial services sector focusing on power infrastructure, has demonstrated strong fundamentals. Recent financials reflect robust earnings growth, backed by government initiatives in the power sector and increasing demand for power infrastructure financing. With the Indian government's emphasis on renewable energy and electrification projects, REC is well-positioned to benefit from these developments.
Additionally, REC's involvement in various government schemes, its status as a Navratna company, and strong backing by the Government of India provide further financial stability and growth prospects. Its debt-to-equity ratio and other financial health indicators are stable, supporting its long-term investment case.
The combination of these technical patterns and solid fundamentals makes REC Limited a compelling stock for long-term investors, aiming for the target of ₹850, keeping in mind the recommended stop loss at ₹388 to manage risks effectively.
**Investment Rationale:**
- **Technical breakout**: Flag and pole pattern suggesting continuation of prior uptrend.
- **Government initiatives**: Strong involvement in government-backed power infrastructure projects.
- **Financial health**: Robust financials with stable debt management and profitability metrics.
**Risk Considerations:**
- **Market volatility**: Broader market fluctuations and sector-specific risks.
- **Regulatory changes**: Any adverse regulatory changes could impact profitability.
Investors should stay updated on quarterly earnings reports and sector developments to adjust their strategies accordingly.

Rec ltd longthis stock recent complete descending triangle corrrection daily time period and move upside breakout level b-d trendline cross .

Triple Top Breakout - RECLTD 📊 Script: REC
📊 Sector: Finance
📊 Industry: Finance - Term-Lending Institutions
Key highlights: 💡⚡
📈 Script is giving breakout of Triple Top pattern of daily chart with volume.
📈 Today was the result date and numbers are pretty good.
📈 Trading at upper band of Bollinger band and giving breakout of it.
📈 MACD and Double Moving Averages are giving Crossover.
📈 RSI is around 70.
📈 Initially we may see some profit booking because stock was up almost 10%.
📈 One can go for Swing Trade.
⏱️ C.M.P 📑💰- 507
🟢 Target 🎯🏆 - 551
⚠️ Stoploss ☠️🚫 - 488
⚠️ Important: Always maintain your Risk & Reward Ratio.
✅Like and follow to never miss a new idea!✅
Disclaimer: I am not SEBI Registered Advisor. My posts are purely for training and educational purposes.
Eat🍜 Sleep😴 TradingView📈 Repeat 🔁
Happy learning with trading. Cheers!🥂

Falling wedge on RECLTDRECLTD formed a falling wedge pattern on daily chart. Looking at the angle at which the pattern has formed one can expect a slow climb towards the target. Moreover price has tested multiple support and resistance point that would act as a good support for price when it goes down. Both bullish swing and bearish swing were equal in power so skipping this one. Still a good risk reward but lots of other opportunities out there.
Hope you liked my idea. If you do, please boost this idea or leave a comment below on what you think. I'll be glad to hear form you. Otherwise, happy trading :-)

Broken out of falling wedges, REC. REC is breaking out of falling wedges.
A successful breakout may result in a 20% upmove in the coming days.

RECLTD U-TURN??RECLTD can give a good swing or positional trade with a decent stoploss and good Targets one can go long with levels like,
ENTRY - 448
STOPLOSS - 444
TARGETS- 460, 470, 485++
Note- if any trade or value that's gone from the marked levels then that's not our trade just let it go or wait for it to come back
I'm not sebi registered this is my personal view
Please like or boost my idea if you like it or traded it
Thankyou


REC breaking 52 weeks high ( march end)just a personal opinion about the future, as said I am not any professional trader or analyst.

RECLTD - A lion is about to roar.RECLTD CMP 461
Key Observations :
>> Hammer Candle at Support
>> 50 DEMA Support Confirmation
>> Volume Spurt
CMP 461
Support 440
Resistance 530-580-630
Note : Personal View Only. Not a Recommendation. DYOR & Invest.

[HP] RECLTD Short IdeaNote -
One of the best forms of Price Action is to not try to predict at all. Instead of that, ACT on the price. So, this chart tells at "where" to act in "what direction. Unless it triggers, like, let's say the candle doesn't break the level which says "Buy if it breaks", You should not buy at all.
=======
I use shorthands for my trades.
"Positional" - means You can carry these positions and I do not see sharp volatility ahead. (I tally upcoming events and many small kinds of stuff to my own tiny capacity.)
"Intraday" -means You must close this position at any cost by the end of the day.
"Theta" , "Bounce" , "3BB" or "Entropy" - My own systems.
=======
I won't personally follow any rules. If I "think" (It is never gut feel. It is always some reason.) the trade is wrong, I may take reverse trade. I may carry forward an intraday position. What is meant here - You shouldn't follow me because I may miss updating. You should follow the system I share.
=======
Like -
Always follow a stop loss.
In the case of Intraday trades, it is mostly the "Day's High".
In the case of Positional trades, it is mostly the previous swings.
I do not use Stop Loss most of the time. But I manage my risk with options as I do most of the trades using derivatives

RECLTD very Bullish Take entry at 210
Target 315
Next average at 155
Double average at 86
It's looks like this counter don't want to stop now. Sector already in bullish mode......after 315 target hit don't sell it.
We will take a review at 315 for next target.
Be invested for 1 year term.

INSTITUTIONAL FAVOURITE CHOICE RECLTDNotice: 📣📣📣📣📣
Today’s golden stock plan has been sent by the teacher team!
Golden Stock: RECLTD
Buying price : 490-510
Stop loss point : 450,
Target : 640
Holding period : within 1 week

Very strong buy back candle on #RECLTDVery strong buy back candle on #RECLTD
I think it still has some juice left.
A weekly candle close below that dotted line will be my SL.

REC looking bearish nowREC is looking bearish now. It has reached the top of the parallel channel. It is expected to start declining from here all the way to the bottom end of the track, it has been travelling into for over the years.

REC 15 Years Break Out! Momentum!!REC has broken out of 15 years range and going up like a rocket. If one looks at 6months/3months/1month charts, I am sure you definitely get surprised! Strong Momentum so far.. Shall I call this Momentum/Madness/Exuberance?

Rec limited on a daily timeframeRec limited on a daily timeframe
Inside bar setup
Entry above 352
SL 330
