Reqeust for Coders Community to Develope XIRR code.Hello, everyone!
I noticed that there’s currently no Extended Internal Rate of Return (XIRR) code available in Pine Script on TradingView. If anyone is interested, please create it! It would be a valuable tool for analyzing investments.
Thanks!
RELIANCE trade ideas

Reliance Very important zone.price can retest the zone and bounce back.
29/10/2024 news:India has overtaken Saudi Arabia to become Europe’s largest supplier of refined fuels, with imports expected to exceed 360,000 barrels per day amid new sanctions on Russian oil.

Reliance Industries Ltd.
### Analysis:
1. **Current Price and Support Level**: The stock is trading around ₹1,334, which appears close to a recent support level near ₹1,322. The stock has shown signs of consolidation at this level.
2. **Resistance Level**: The chart indicates a resistance level around ₹1,503, marking the next significant hurdle. This is where the stock previously faced selling pressure.
3. **Moving Average**: The stock price is below the 44-day Simple Moving Average (SMA) of ₹1,435, suggesting a bearish sentiment in the short term. A move above this SMA could signal a potential reversal.
### Recommendation:
- **Buy Opportunity**: If the stock sustains above the ₹1,322 support level, it could be a good buying opportunity for a target of ₹1,503, providing a potential gain of approximately 13.6%.
- **Stop-Loss**: Place a stop-loss below ₹1,300 to manage risk in case the stock breaks the support.
- **Risk-Reward Ratio**: The chart suggests a favorable risk-reward ratio if the stock bounces from the current level.
**Disclaimer**: This recommendation is based on technical analysis and current market conditions. It's important to consider your risk tolerance and conduct additional research or consult a financial advisor before making investment decisions.

RELIANCE : Reliance Industries Ltd. Weekly Technical Analysis
50 SMA Support Zone
The stock is currently testing support at the 50-period Simple Moving Average (SMA) on the weekly chart, a critical level that has provided support in previous corrections. This SMA often acts as a strong dynamic support, and a bounce from this area could indicate a potential upward movement.
Golden Participation Zone
The price is situated in the Golden Zone (113%-127% of the last swing correction), a Fibonacci-based support area where reversals are likely. This is often seen as a strong entry zone, with a high probability of an upside movement if support holds.
Projected Path and Resistance Areas
If the stock rebounds from the current levels, the First Resistance Area is marked between ₹3,121.95 - ₹3,181.15. Breaking through this zone would be a positive signal, potentially leading to further upside.
Target Zone
The next target zone lies between ₹3,292.15 - ₹3,372.45, aligning with the upper Fibonacci levels. This area could be the next resistance where traders might look to book profits or monitor for breakout confirmation.
Bullish Potential
The projected price path suggests a bullish movement if support at the golden zone and 50 SMA hold, indicating a reversal pattern. A strong bounce from these levels would strengthen the likelihood of a rally towards the target zone.


Reliance BuyBuy Reliance and hold it till March 2025. These 4-5 months return in Reliance will be equal to or more than the returns of average mutual fund returns. It is the best period to buy the company as it is almost 17% down from its lifetime high.
Please do your own analysis before investing.
Hope you learned something new from my ideas.
Do like, share and follow me. thank you!

RELIANCERELIANCE stock shows reversal pattern but it will be more atractive near shown supports.there is trend line which has its own story.

#Reliance completing ABC correction, or its 1,2 and midway of 3?#ElliottWaves #Reliance
Tracking this idea since few weeks. C is between 100% to 123% of Wave A. If ABC is the be confirmed, it should return back to impulse.
Fundamental: Record date for stock split is 28th for which buying should happen by 25th Oct. which may have some upswing possibility.

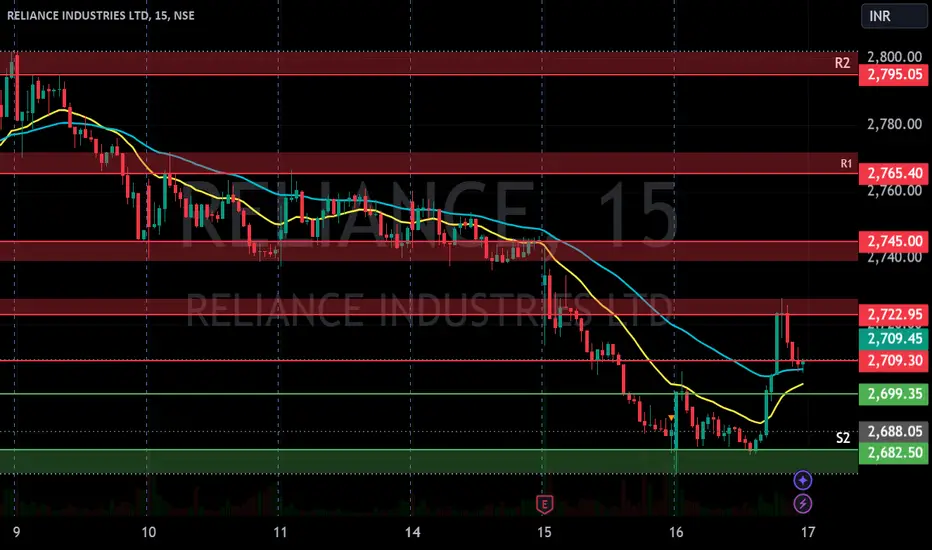
RIL S/R for 17/10/24Support and Resistance Levels:
Support Levels: These are price points (green line/shade) where a downward trend may be halted due to a concentration of buying interest. Imagine them as a safety net where buyers step in, preventing further decline.
Resistance Levels: Conversely, resistance levels (red line/shade) are where upward trends might stall due to increased selling interest. They act like a ceiling where sellers come in to push prices down.
Breakouts:
Bullish Breakout: When the price moves above resistance, it often indicates strong buying interest and the potential for a continued uptrend. Traders may view this as a signal to buy or hold.
Bearish Breakout: When the price falls below support, it can signal strong selling interest and the potential for a continued downtrend. Traders might see this as a cue to sell or avoid buying.
20 EMA (Exponential Moving Average):
Above 20 EMA(50 EMA): If the stock price is above the 20 EMA, it suggests a potential uptrend or bullish momentum.
Below 20 EMA: If the stock price is below the 20 EMA, it indicates a potential downtrend or bearish momentum.
Trendline: A trendline is a straight line drawn on a chart to represent the general direction of a data point set.
Uptrend Line: Drawn by connecting the lows in an upward trend. Indicates that the price is moving higher over time. Acts as a support level, where prices tend to bounce upward.
Downtrend Line: Drawn by connecting the highs in a downward trend. Indicates that the price is moving lower over time. It acts as a resistance level, where prices tend to drop.
RSI: RSI readings greater than the 70 level are overbought territory, and RSI readings lower than the 30 level are considered oversold territory.
Combining RSI with Support and Resistance:
Support Level: This is a price level where a stock tends to find buying interest, preventing it from falling further. If RSI is showing an oversold condition (below 30) and the price is near or at a strong support level, it could be a good buy signal.
Resistance Level: This is a price level where a stock tends to find selling interest, preventing it from rising further. If RSI is showing an overbought condition (above 70) and the price is near or at a strong resistance level, it could be a signal to sell or short the asset.
Disclaimer:
I am not a SEBI registered. The information provided here is for learning purposes only and should not be interpreted as financial advice. Consider the broader market context and consult with a qualified financial advisor before making investment decisions.
Elliott Wave Outlook for RELIANCETechnical Analysis of Reliance Industries (RELIANCE) based on Elliott Waves
This analysis is based on Elliott Wave Theory and is for educational purposes only. It does not constitute financial advice. Investing involves risk, and past performance is not indicative of future results. Always consult with a financial advisor before making any investment decisions.
Elliott Wave Analysis
The provided chart of Reliance Industries (RELIANCE) outlines a potential Elliott Wave pattern within a 1-hour timeframe. Elliott Wave Theory suggests that financial markets move in predictable and repeatedly patterns based on investor psychology.
Key Observations:
1. Impulse Wave: The primary uptrend appears to be an impulse wave, a five-wave structure.
Wave 1: The initial uptrend from the low point.
Wave 2: A minor correction or pullback.
Wave 3: A strong extension of the uptrend.
Wave 4: A smaller correction.
Wave 5: The final wave of the impulse, often ending with a climactic price movement.
2. Corrective Wave: The current downward movement was a zigzag corrective pattern.
Wave A: The initial decline.
Wave B: A minor retracement.
Wave C: The expected continuation of the downward trend.
Potential Scenario:
If the current corrective pattern zigzag finishes here or near, then further wave ((3)) is to start post completion of wave (C) of ((2)), and it would not go sudden upside, because any impulse wave unfolds in five subdivisions, so wave (1) of wave ((3)) can start any time post completion of wave (C) of wave ((2)).
Note: This analysis is based on a specific interpretation of the Elliott Wave pattern. Other analysts might have different interpretations. It's crucial to use multiple tools and indicators to confirm your analysis.
Additional Considerations:
Fundamental Analysis: Consider factors like company earnings, industry trends, and economic indicators to support your technical analysis.
Risk Management: Always use stop-loss orders to limit your potential losses.
Diversification: Don't put all your eggs in one basket. Diversify your investments across different assets.
Remember: Elliott Wave analysis is a complex tool that requires practice and experience. It's essential to approach it with caution and always consider the potential risks involved in trading.
I am not Sebi registered analyst.
My studies are for educational purpose only.
Please Consult your financial advisor before trading or investing.
I am not responsible for any kinds of your profits and your losses.
Most investors treat trading as a hobby because they have a full-time job doing something else.
However, If you treat trading like a business, it will pay you like a business.
If you treat like a hobby, hobbies don't pay, they cost you...!
Hope this post is helpful to community
Thanks
RK💕
Disclaimer and Risk Warning.
The analysis and discussion provided on in.tradingview.com is intended for educational purposes only and should not be relied upon for trading decisions. RK_Charts is not an investment adviser and the information provided here should not be taken as professional investment advice. Before buying or selling any investments, securities, or precious metals, it is recommended that you conduct your own due diligence. RK_Charts does not share in your profits and will not take responsibility for any losses you may incur. So Please Consult your financial advisor before trading or investing.

[Positional] Reliance Buy IdeaNote -
One of the best forms of Price Action is to not try to predict at all. Instead of that, ACT on the price. So, this chart tells at "where" to act in "what direction. Unless it triggers, like, let's say the candle doesn't break the level which says "Buy if it breaks", You should not buy at all.
=======
I use shorthands for my trades.
"Positional" - means You can carry these positions and I do not see sharp volatility ahead. (I tally upcoming events and many small kinds of stuff to my own tiny capacity.)
"Intraday" -means You must close this position at any cost by the end of the day.
"Theta" , "Bounce" , "3BB" or "Entropy" - My own systems.
=======
I won't personally follow any rules. If I "think" (It is never gut feel. It is always some reason.) the trade is wrong, I may take reverse trade. I may carry forward an intraday position. What is meant here - You shouldn't follow me because I may miss updating. You should follow the system I share.
=======
Like -
Always follow a stop loss.
In the case of Intraday trades, it is mostly the "Day's High".
In the case of Positional trades, it is mostly the previous swings.
I do not use Stop Loss most of the time. But I manage my risk with options as I do most of the trades using derivatives

RIL S/R for 16/10/24Support and Resistance Levels:
Support Levels: These are price points (green line/shade) where a downward trend may be halted due to a concentration of buying interest. Imagine them as a safety net where buyers step in, preventing further decline.
Resistance Levels: Conversely, resistance levels (red line/shade) are where upward trends might stall due to increased selling interest. They act like a ceiling where sellers come in to push prices down.
Breakouts:
Bullish Breakout: When the price moves above resistance, it often indicates strong buying interest and the potential for a continued uptrend. Traders may view this as a signal to buy or hold.
Bearish Breakout: When the price falls below support, it can signal strong selling interest and the potential for a continued downtrend. Traders might see this as a cue to sell or avoid buying.
20 EMA (Exponential Moving Average):
Above 20 EMA(50 EMA): If the stock price is above the 20 EMA, it suggests a potential uptrend or bullish momentum.
Below 20 EMA: If the stock price is below the 20 EMA, it indicates a potential downtrend or bearish momentum.
Trendline: A trendline is a straight line drawn on a chart to represent the general direction of a data point set.
Uptrend Line: Drawn by connecting the lows in an upward trend. Indicates that the price is moving higher over time. Acts as a support level, where prices tend to bounce upward.
Downtrend Line: Drawn by connecting the highs in a downward trend. Indicates that the price is moving lower over time. It acts as a resistance level, where prices tend to drop.
RSI: RSI readings greater than the 70 level are overbought territory, and RSI readings lower than the 30 level are considered oversold territory.
Combining RSI with Support and Resistance:
Support Level: This is a price level where a stock tends to find buying interest, preventing it from falling further. If RSI is showing an oversold condition (below 30) and the price is near or at a strong support level, it could be a good buy signal.
Resistance Level: This is a price level where a stock tends to find selling interest, preventing it from rising further. If RSI is showing an overbought condition (above 70) and the price is near or at a strong resistance level, it could be a signal to sell or short the asset.
Disclaimer:
I am not a SEBI registered. The information provided here is for learning purposes only and should not be interpreted as financial advice. Consider the broader market context and consult with a qualified financial advisor before making investment decisions.

Reliance breaks the trend line and mid channel support. Reliance breaks the trend line and mid channel support after below par support. Only saving grace can be that it is entering the oversold zone and another major support territory. The major support territory for Reliance is 2561 and 2657. We can expect a reversal from this zone. The stock can be added post bounce and further compounded after it crosses the mother and father line. After bottom formation takes place. Which has not taken place as of now.
The stock can be bought/added/averaged in X/4 quantity. Remaining 3 X/4 entries will be above Mother line 50 days EMA, above Father line that is 200 days EMA and finally after closing above 3007. As it is a long term investment Idea and Portfolio stock, Part of my personal portfolio too I would rather not keep a stop loss here. If a trader and investor wants to keep a stop loss he / she can do it after monthly closing below 2250 zone.
One or 2 quarters poor / below market expectation result should not deter an investor in holding on to GEMs. Jio Platforms Q2 profit rises 23.4% to Rs 6,539 crore; ARPU for JIO is at Rs 195.1. Green Energy Segment may start performing for Reliance from 2025. Long term outlook for the stock still remains positive.
Disclaimer: The above information is provided for educational purpose, analysis and paper trading only. Please don't treat this as a buy or sell recommendation for the stock. We do not guarantee any success in highly volatile market or otherwise. Stock market investment is subject to market risks which include global and regional risks. I an my clients have long positions in this stock. We will not be responsible for any Profit or loss that may occur due to any financial decision taken based on any data provided in this message.

Reliance A Good Base Line Level Reliance is about to reach a bottom level of trend zone . Get ready for investment below this level . also provided the sideways zone levels .

Understanding the Renko Bricks (Educational Article)Today we are going to study a chart which is called a Renko chart. Renko chart is a chart which is typically used to study price movement. I use Renko chart many times to determine supports and resistnace. I find it easy and accurate way of determining supports and resistances. The word Renko is derived from Japanese word renga.
Renga means brick. As you can see in the chart below it shows a kind of Brick formation. The brick size is determined wither by the user and mostly it depends of typical average movement on the stock historically.
A new brick is formed once the price moves upwards on downwards in the same proportion or ratio of the typical brick. New brick is only added post the price moves in that particular proportion. A new brick might not be added in months if the price movement is not as per the ratio. At the same time a new brick might be added in a day or few bricks in a week is price moves accordingly.
We will try to understand this concept further by looking at the chart in the post. We have used the chart of Reliance industries to understand this concept and concept only. Please do not consider this buy or sell call for the stock. As you can see in the above chart I have used a combination of RSI, EMA (50 and 200 days) and Bollinger band strategy. RSI support for Reliance is at 35.89 with current RSI at 40.13. Bollinger band suggests that support might be round the corner for the stock. The peaks from previous tops are used to find out further supports and resistances. Mid Bollinger band level and Bollinger band top level coincide with other pervious tops making them tough resistance when the price moves upwards. Mother line EMA is a resistance now and Father line EMA support is far away. All these factors indicate the support zones for the stock to be around 2736, 2657, 2601 and 2561 in the near term. Resistance for Reliance seem to be at 2814, 2972, 3006, 3048 and 3202 levels. Let me give a disclaimer again. The above data is for analysis purpose and to understand Bollinger band, RSI, effect of EMA and Renko Bricks only. Please do not trade based on the information provided here as it is just for understanding Renko charts.
Disclaimer: There is a chance of biases including confirmation bias, information bias, halo effect and anchoring bias in this write-up. Investment in stocks, derivatives and mutual funds is subject to market risk please consult your investment advisor before taking financial decisions. The data, chart or any other information provided above is for the purpose of analysis and is purely educational in nature. They are not recommendations of any kind. We will not be responsible for Profit or loss due to descision taken based on this article. The names of the stocks or index levels mentioned if any in the article are for the purpose of education and analysis only. Purpose of this article is educational. Please do not consider this as a recommendation of any sorts.

Reliance is looking weakHere in Reliance Industries, we can see a downtrend. Reliance can take a support near 2720 and if it is not able to manages here at support for reversal then below 2720, we can see a sharp sell off up to 2655 & 2580.

Reliance on Bearish mode - Forming Cypher/SharkReliance has moved below 20 / 50 / 100 EMA & closed below support of 2904.
With the confirmation of Bearish Cypher/Shark pattern, it is expected to follow 2865 / 2800 / 2730.

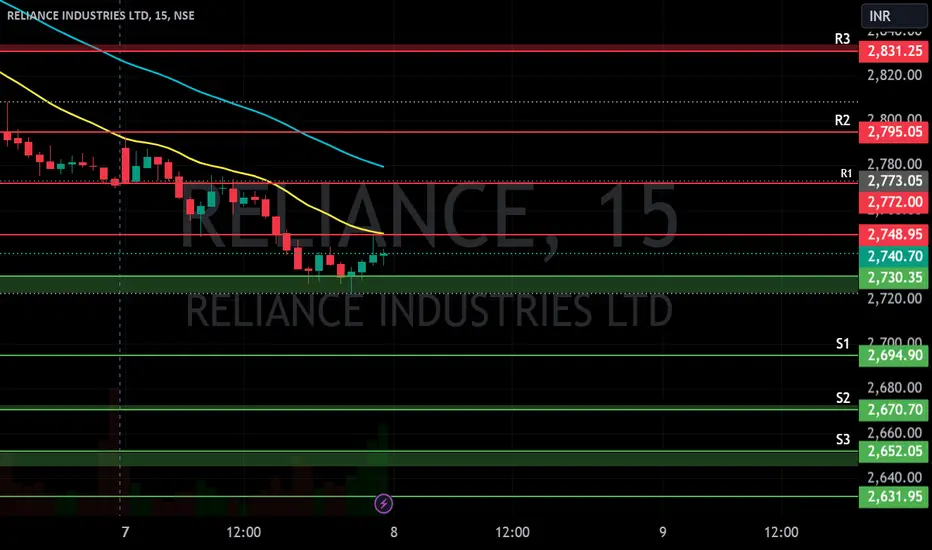
RIL S/R for 8/10/24Support and Resistance Levels:
Support Levels: These are price points (green line/shade) where a downward trend may be halted due to a concentration of buying interest. Imagine them as a safety net where buyers step in, preventing further decline.
Resistance Levels: Conversely, resistance levels (red line/shade) are where upward trends might stall due to increased selling interest. They act like a ceiling where sellers come in to push prices down.
Breakouts:
Bullish Breakout: When the price moves above resistance, it often indicates strong buying interest and the potential for a continued uptrend. Traders may view this as a signal to buy or hold.
Bearish Breakout: When the price falls below support, it can signal strong selling interest and the potential for a continued downtrend. Traders might see this as a cue to sell or avoid buying.
20 EMA (Exponential Moving Average):
Above 20 EMA(50 EMA): If the stock price is above the 20 EMA, it suggests a potential uptrend or bullish momentum.
Below 20 EMA: If the stock price is below the 20 EMA, it indicates a potential downtrend or bearish momentum.
Trendline: A trendline is a straight line drawn on a chart to represent the general direction of a data point set.
Uptrend Line: Drawn by connecting the lows in an upward trend. Indicates that the price is moving higher over time. Acts as a support level, where prices tend to bounce upward.
Downtrend Line: Drawn by connecting the highs in a downward trend. Indicates that the price is moving lower over time. It acts as a resistance level, where prices tend to drop.
RSI: RSI readings greater than the 70 level are overbought territory, and RSI readings lower than the 30 level are considered oversold territory.
Combining RSI with Support and Resistance:
Support Level: This is a price level where a stock tends to find buying interest, preventing it from falling further. If RSI is showing an oversold condition (below 30) and the price is near or at a strong support level, it could be a good buy signal.
Resistance Level: This is a price level where a stock tends to find selling interest, preventing it from rising further. If RSI is showing an overbought condition (above 70) and the price is near or at a strong resistance level, it could be a signal to sell or short the asset.
Disclaimer:
I am not a SEBI registered. The information provided here is for learning purposes only and should not be interpreted as financial advice. Consider the broader market context and consult with a qualified financial advisor before making investment decisions.

Reliance Key observation
Prices are below key moving average
Rejection from 3223 prices are making lower high lower low pattern once scrip is bottom out we may see see reversal
Key levels -2905 laxman rekha the price should manage to sustain above these levels so we may see good momentum on upside
Target of 3200-3300
(Price are heading towards 2702 very
important key support )
View -Educational purpose do your own analysis before you make any decision


RIL S/R for 4/10/24Support and Resistance Levels:
Support Levels: These are price points (green line/shade) where a downward trend may be halted due to a concentration of buying interest. Imagine them as a safety net where buyers step in, preventing further decline.
Resistance Levels: Conversely, resistance levels (red line/shade) are where upward trends might stall due to increased selling interest. They act like a ceiling where sellers come in to push prices down.
Breakouts:
Bullish Breakout: When the price moves above resistance, it often indicates strong buying interest and the potential for a continued uptrend. Traders may view this as a signal to buy or hold.
Bearish Breakout: When the price falls below support, it can signal strong selling interest and the potential for a continued downtrend. Traders might see this as a cue to sell or avoid buying.
20 EMA (Exponential Moving Average):
Above 20 EMA(50 EMA): If the stock price is above the 20 EMA, it suggests a potential uptrend or bullish momentum.
Below 20 EMA: If the stock price is below the 20 EMA, it indicates a potential downtrend or bearish momentum.
Trendline: A trendline is a straight line drawn on a chart to represent the general direction of a data point set.
Uptrend Line: Drawn by connecting the lows in an upward trend. Indicates that the price is moving higher over time. Acts as a support level, where prices tend to bounce upward.
Downtrend Line: Drawn by connecting the highs in a downward trend. Indicates that the price is moving lower over time. It acts as a resistance level, where prices tend to drop.
RSI: RSI readings greater than the 70 level are overbought territory, and RSI readings lower than the 30 level are considered oversold territory.
Combining RSI with Support and Resistance:
Support Level: This is a price level where a stock tends to find buying interest, preventing it from falling further. If RSI is showing an oversold condition (below 30) and the price is near or at a strong support level, it could be a good buy signal.
Resistance Level: This is a price level where a stock tends to find selling interest, preventing it from rising further. If RSI is showing an overbought condition (above 70) and the price is near or at a strong resistance level, it could be a signal to sell or short the asset.
Disclaimer:
I am not a SEBI registered. The information provided here is for learning purposes only and should not be interpreted as financial advice. Consider the broader market context and consult with a qualified financial advisor before making investment decisions.

Reliance Looking Good...Buy REL at current level and all dips
Target1 - 3000
Target2 - 3200
Target3 - 3627 (if close above 3210)
Disclaimer :-
I am not SEBI registered. The information provided here is for education purposes only.
I will not be responsible for any of your profit/loss with this channel suggestions.
Consult your financial advisor before taking any decisions
