After recent correction Rico auto industries...After recent correction looks like Rico Auto found the base at 75 and will not go below 75, one can start buying in tranches for targets towards ATH...slow move....
RICOAUTO trade ideas
Rico auto : Rico auto
CMD 80
Target 10% around 88
SL 3% or 76
This is not buy or sell recommendation
RICOAUTO | Buy @LTP | SL below 73 | 1st Target 100, 126, 150Disclaimer:
This is not financial advice. Please do your own research or consult with a financial advisor before making any investment decisions. Investments in stocks can be risky and may result in loss of capital.

rico auto 3m time frame Buy @ 93 target @ 149, 169, 186, 197 rico auto 3m time frame
Buy @ 93 target @ 149, 169, 186, 197
Risk reward 3.2
resistance breakout
Its just a view trade@ your own risk
sl@ 62.64

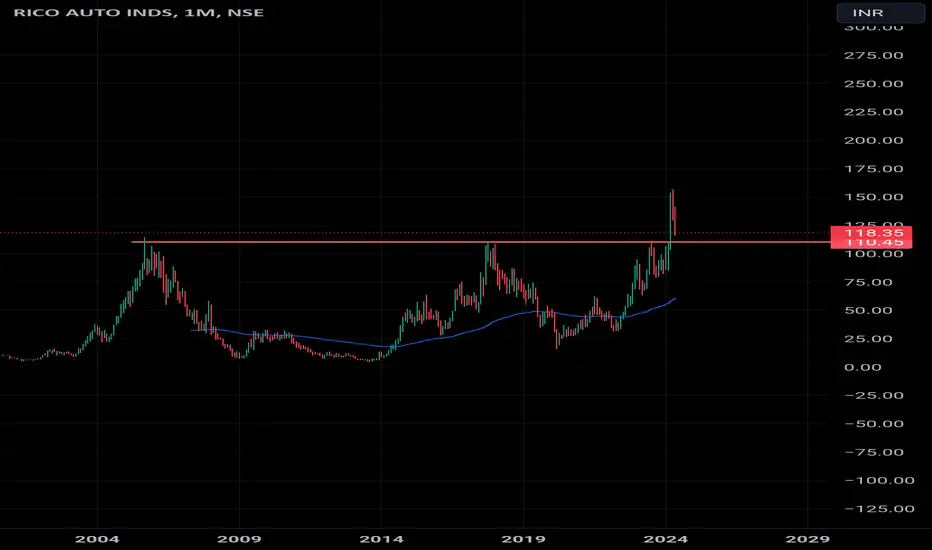
RICO auto retesting after 19 years breakoutRICO auto retesting after 19 years breakout . Watch and make right entry on right price

Rico autoRico auto monthly chart self explanatory..2005-06/2017 k top ka Breakout in 2024..retested and up..can ride the journey with small stoploss of 114/100.. on closing basis.

Rico Auto Industries Ltd. (RICOAUTO)Target 200%For Rico Auto Industries Ltd. (RICOAUTO), based on the chart and considering a fundamental approach, here's an analysis and recommendation for trading:
### Technical Analysis:
- **Current Market Price**: The stock's current price is around ₹122.75.
- **Proposed Stop Loss**: Below ₹93, which provides a safety buffer to mitigate risk in case of a downward price movement. This stop loss is strategically placed below significant historical support levels visible in the chart.
- **Target**: ₹225, suggesting a potential significant upward movement. This target appears ambitious and would require substantial positive momentum or company developments to be achieved.
### Fundamental Analysis:
Rico Auto Industries is engaged in the engineering and manufacturing of auto components, a sector that benefits from both domestic growth in auto sales and export opportunities. Factors to consider include:
- **Industry Outlook**: The auto component industry is closely tied to the automotive industry's cyclical nature, which is currently showing signs of recovery post-pandemic.
- **Financial Health**: It's essential to review recent earnings, debt levels, and cash flow statements to ensure the company is financially stable and capable of sustaining operations without undue financial strain.
- **Growth Potential**: Look into recent announcements regarding new contracts, expansion into new markets, or innovations in product lines that could drive revenue growth.
### Recommendation:
Considering the technical setup and the fundamental aspects of the industry, Rico Auto presents a potentially attractive medium to long-term investment opportunity. However, given the aggressive nature of the target price:
- **Entry Strategy**: Consider entering at current levels or on a slight dip to optimize the entry point, provided the fundamental outlook remains strong.
- **Risk Management**: The substantial gap between the current price and the stop loss suggests a need for tight monitoring. Adjust the stop loss as the stock moves to lock in gains and minimize potential losses.
- **Monitoring**: Keep a close watch on quarterly results, industry news, and market conditions that might impact the stock price.
This recommendation assumes a favorable macroeconomic environment and stable market conditions. Always consider aligning such trades with your overall investment strategy and risk tolerance.

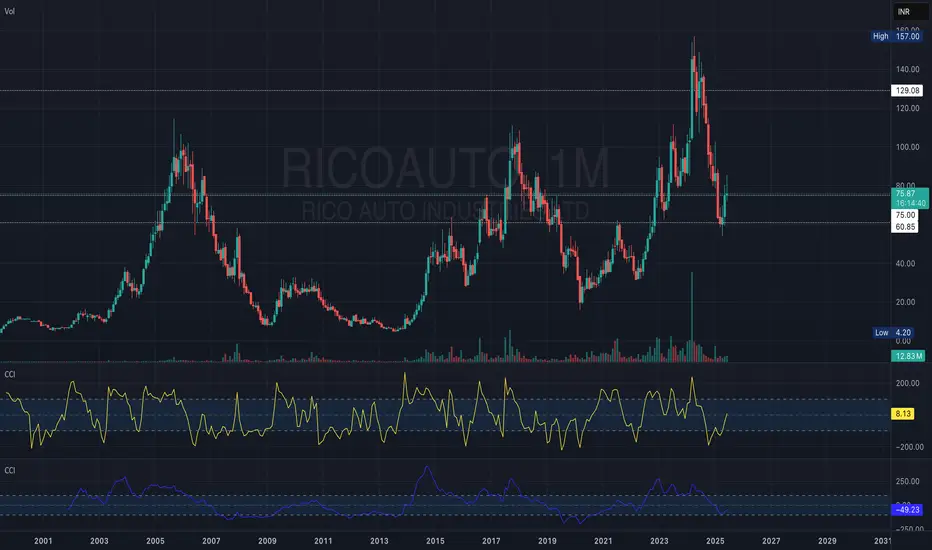
RICO AUTO STRUGGLING The 2024 annual results of Rico Auto did not present significant figures, which explains the lack of strong buying interest despite the stock reaching a high of 157 on April 3rd. Since then, it appears to be consolidating its position. It seems investors are awaiting the quarterly results of this stock to consider bulk purchases, which will be disclosed in July/August. Until then, it may continue to retest its previous highs and recent lows.

RICO AUTO's engine is starting!RICO AUTO has just confirmed a breakout and is all set to soar higher!
Get in and put on your seat belts because this ride is going to speed up!

RICO AUTO..Flag BreakoutGave a flag breakout..tgt calculated as per rule is posted on the chart...time tgt too given...so Buy..looks good...All the best

RICO AUTORico auto has breakout nearly 19 years resistance and retest that level
TGT upto 229 SL bellow 120
and this is only for educational purpose


20 years breakout Rico IndiaThis stock has given breakout after 20 years
recently it broke resistance of 110 and moved up with strong volumes
But to enter lets wait for retest and make entry@110 SL should not be more than 5-7 %
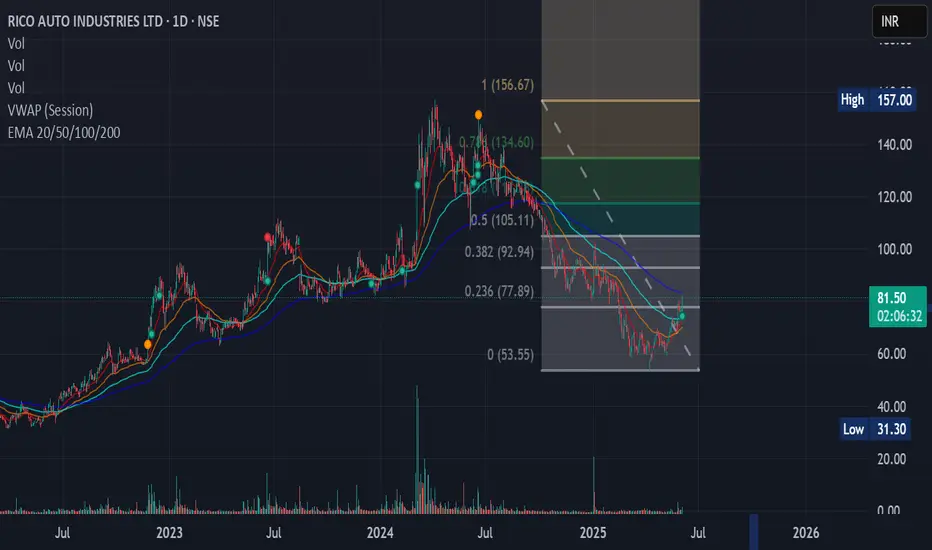
Revving Up for Riches: Rico's Rebound at Multi-Year Support CoulOverview:
Rico Auto Industries Ltd. (Rico) is currently retesting its multi-year support level, which suggests a critical juncture for potential investors. The price range of 110-114 has been identified as a significant support zone where the stock has historically shown tendencies to reverse. If the stock manages to reverse and sustain above this level, it could present an opportunity for substantial gains, potentially doubling in value (2x candidate).
Technical Indicators (Monthly Chart):
1. **Support Level**:
- **Current Support Zone**: 110-114.
- The stock is retesting this multi-year support, which has previously acted as a strong foundation for price rebounds.
2. **Price Action**:
- The recent price action indicates that Rico is approaching its crucial support zone.
- A reversal from this zone could signal the end of the downtrend and the beginning of a new uptrend.
3. **Moving Averages**:
- **9, 21, 55, and 200-period EMAs**: The stock's price relative to these moving averages would provide further insights, but given the bullish outlook, it is likely positioned favorably or approaching a crossover that indicates a bullish trend.
4. **Supertrend**:
- The supertrend indicator is likely green or showing signs of turning green, indicating a favorable trend direction on the monthly chart.
5. **Relative Strength Index (RSI)**:
- The RSI on the monthly chart is above 50, indicating positive momentum and bullish sentiment. This suggests that the buying pressure is currently stronger than the selling pressure.
6. **Relative Strength (RS)**:
- The RS is above 0, which means Rico is outperforming the market, a bullish indicator that adds confidence to the stock's potential upward movement.
7. **Volume Analysis**:
- Increased trading volume during this retest phase would be a positive sign, indicating accumulation by investors at the support level.
#### Trading Strategy:
1. **Entry Point**:
- Look for a confirmed reversal signal within the 110-114 support zone, such as a bullish candlestick pattern (e.g., hammer, bullish engulfing) or a strong bounce with significant volume.
- Entering near the lower end of this range could maximize potential gains and minimize risk.
2. **Stop Loss**:
- Place a stop loss just below the 110 support level to protect against downside risk. This ensures that if the support does not hold, potential losses are limited.
3. **Target Levels**:
- **First Target**: Consider initial resistance levels or recent highs as intermediate targets.
- **Ultimate Target**: Based on the 2x potential, if the stock reverses and sustains, the long-term target could be approximately 220-228.
4. **Monitoring**:
- Continuously monitor the technical indicators and price action to ensure that the bullish thesis remains valid.
- Watch for any changes in market conditions or company-specific news that could impact the stock’s performance.
### Conclusion:
Rico is at a critical juncture, retesting its multi-year support level at 110-114. The technical indicators on the monthly chart are bullish, suggesting that a reversal from this zone could lead to significant gains. If Rico reverses and sustains above this support, it has the potential to become a 2x candidate. Traders and investors should consider entering near the support level, with appropriate risk management strategies in place, to capitalize on this potential opportunity.
Disclaimer: The information provided in this analysis is for informational purposes only and should not be considered as financial advice. Investing in the stock market involves risks, including the loss of principal. Before making any investment decisions, it is recommended to conduct your own research and consult with a licensed financial advisor. The author does not guarantee any specific outcomes and is not responsible for any losses that may occur as a result of investing based on the information provided in this analysis.

RICO AUTO INDSThis stock breakout 20 years resistance level TGT will be 1X
and This is only for educational purpose

rico auto 1m time frame buy@ 134.50 target @ 170.40, 199, 220rico auto 1m time frame
buy@ 134.50 target @ 170.40, 199, 220, 260.50
risk reward 3.5
ascending channel breakout
its just a view trade @ your own risk
sl@ 98.40

RICO AUTO Multiyear Breakout (Monthly chart)Cup & Handle pattern
RSI above 60 Daily / Weekly / Monthly
EMA in line 21 / 50 / 200
Volume Growth
Support 88
expected level 204

RICOAUTO.. UPSIDE MOVEMENT NOW...it takes rest of liquidity or pending orders from here...and posile to move our targets..

RicoAutoINDSRicoAutoINDS Monthly chart breakout buy on dip. Break Double Bottom 1Target 200 & 2Target 275..

Rico Auto for 90% upmove Take entry above 114 only
14 months target 221
1st average at 65
2nd double average at 31Rs
Sell with 90 % profit
Bullish on auto ind.
Entry condition must be above 114
Take entry according to condition and sit relax.

Rico Auto Industries Ltd*Rico Auto Industries Ltd*
C&H Formation on Yearly Basis.
Strong Price BreakOut & Sustained.
Vol. BuiltUp gaining Traction.
RSI: 1H >D >W >M: All in Bullish Zone.
EMAs: 20/ 50/ 100/ 200: Gap Widening Across Timeframes.
*Trail SL with Upside*
*Book Profit as per Risk Appetite*
*_Do Your Own Research as. This is an Opinion_*
Happy Investing 😇

RICOAUTO super setupRICOAUTO super setup to buy...Ultimate target 202...
This is only for educational purpose.
