RITES - base formationRites is forming a base and expect an upward momentum. Strong fundamentals and technical added advantage. Keep a SL @ 285. R1 309 R2 315 R3 325.
RITES trade ideas

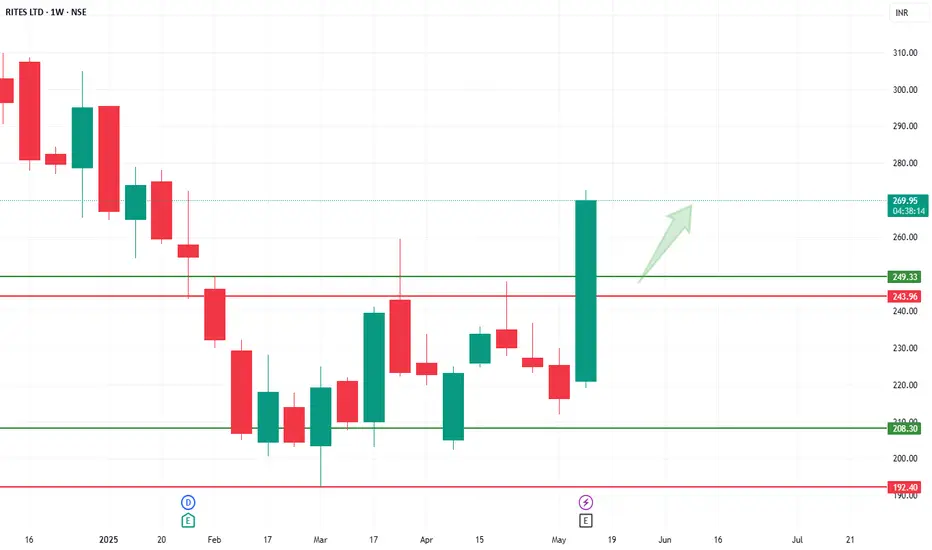
RITESRITES showing good strength in recent session. And currently trading near strong hurdle. It has a strong resistance near 310-15 levels and rejected many times earlier. So if now closing above 315 may start new momentum rally in the counter which may continue for next 20-22% upwards. On lower side 270 seems very good support But closing above 315 is very crucial. I would avoid before that but surely keep a closer watch on it.

RITESRITES
watch above levels. green line is our entry, redline is our SL.
DISCLAIMER : I am NOT a SEBI registered advisor or a financial adviser. All the views are for educational purpose only.
RITES for Swing and Short Positional viewAs we can see H3 chart already has created reversal CHoCH which is a good signal of bullish view. After inducement (X) taken out candles have created M15 Ch and price is trading in the discount zone (<Rs 225/-) of previous impulsive leg (the low & high swing points already mentioned on the chart with yellow dot)
So, we can buy at the demand zone or at any price level below Rs 225/-and can hold up to 1-2 months for 20-25% return.

RITES: INVERSE H&S BREAKOUTThe Inverse Head and Shoulders pattern is a bullish reversal chart pattern that signals a potential trend reversal from bearish to bullish. It consists of three key components:
Structure of the Pattern:
Left Shoulder: A price decline followed by a temporary rally.
Head: A deeper decline forming the lowest point, followed by another rally.
Right Shoulder: A decline similar in size to the left shoulder but not as deep as the head, followed by a move higher.
Neckline: A resistance level that connects the highs of the two rallies after the left shoulder and head.
The Inverse Head and Shoulders pattern in RITES, with a neckline at ₹225, indicates a potential bullish reversal. The stock has formed a well-defined left shoulder, head, and right shoulder, suggesting that selling pressure is weakening. The target price for this breakout is ₹263 calculated by measuring the distance from the head’s low to the neckline and projecting it upwards. If the stock sustains above the neckline, it could gain further momentum. However, traders should consider placing a stop-loss at 212 to manage risk in case of a failed breakout.

RITES giving bamboo to investorsRITES pays dividends, stock split etc.....but it has given major bamboo to its investors after the major run up...The most likely reversal area is around 150-160....provided we see some price action there....I wouldn't have much hope unless the overall Indian market sentiment improves.. Why can't they remove LTCG tax? FIIs are getting better returns putting their money in UAE which is giving 5% without tax.....Here Nifty might give 5% with the additional risk , because LTCG makes it less enticing to invest...Right now, this stock is in a death spiral....I have bought some at these levels and will continue to average down....Multiple sell orders till 400.....Keep in mind FIIs are still aggressively selling.....and FDs are giving better returns now.....so invest at your own risk....

Rites BO after accumulationThe stock is showing a breakout (Bo) after accumulating at support levels.
This presents a favorable risk-reward ratio (R:R) for trading, especially with a small stop loss (SL).
Volumes are also shooting 'up.
It's worth noting that there’s a trendline that has been respected for a long time.
Breakout should be with a strong candle (TF as we used in chart); then the entry will be after the consecutive candle which should be breaching the breakout candle.
Do your own research before investing

RITES LTDAnalyst consensus provides a median price target of ₹325.50, representing a potential upside of about 16.52% from the current price.
TRENDLYNE
In terms of valuation metrics, the company has a Price-to-Earnings (P/E) ratio of 33.81, a Price-to-Sales (P/S) ratio of 6.51, and a Price-to-Book (P/B) ratio of 4.95.
ECONOMIC TIMES
Given these factors, while RITES Ltd. exhibits strong financial health, the current market price appears to be higher than its estimated intrinsic value. Potential investors should consider this overvaluation and the limited upside potential when making investment decisions.

SWING IDEA - RITESRITES , a leading engineering consultancy company specializing in transport infrastructure, is showing technical signals that suggest a promising swing trading opportunity.
Reasons are listed below :
770-800 Resistance Zone : The 770-800 level has been tested multiple times and the price is now attempting to break through this resistance, indicating strong bullish momentum.
Ascending Triangle Breakout : The price is breaking out of an ascending triangle pattern, a bullish continuation pattern that suggests potential for further upward movement.
Bullish Engulfing Candle on Daily Timeframe : The recent formation of a bullish engulfing candle on the daily chart indicates strong buying pressure and further supports the bullish case.
50 EMA Support : The stock is finding support at the 50-day exponential moving average (EMA), reinforcing the overall bullish sentiment and providing a strong support level.
Trading at All-Time High : The stock is trading at its all-time high, suggesting strong market confidence and potential for further gains.
Spike in Volume : A noticeable increase in trading volumes confirms the strength of the price move and indicates growing investor interest.
Target - 930 // 1030
Stoploss - daily close below 680
DISCLAIMER -
Decisions to buy, sell, hold or trade in securities, commodities and other investments involve risk and are best made based on the advice of qualified financial professionals. Any trading in securities or other investments involves a risk of substantial losses. The practice of "Day Trading" involves particularly high risks and can cause you to lose substantial sums of money. Before undertaking any trading program, you should consult a qualified financial professional. Please consider carefully whether such trading is suitable for you in light of your financial condition and ability to bear financial risks. Under no circumstances shall we be liable for any loss or damage you or anyone else incurs as a result of any trading or investment activity that you or anyone else engages in based on any information or material you receive through TradingView or our services.
@visionary.growth.insights

RITES GIVES BRAKEOUT ON DAILY CHARTNSE:RITES
RITES gives brake out on daily chart.
I am buying this stock
Near 750
And follow sl on 660
My target will be 890
My risk reward ratio is 1:1.50
Return on capital 20%


RITES BULLISHRITE formed good breakout trade with a decisive bullish candle resistance level 1. 805 2. 900

RITES Long PositionalRites Looking good on Chart
Above 20 & 50 EMA
Breaking the resistance with Volume
Targets - 556-592-630

Symmetrical triangle on RITESRITES formed a symmetrical triangle pattern on daily chart. With multiple support level tested, it is looking good. Also looking at the way the price has broken out of resistance with charging bulls, probability of price going up is higher. Stop loss can be held just below the breakout candle. Any swing low could give you an entry with target at 52week high.
Hope you liked this idea, if so please boost this idea so others could benefit or leave a comment on what you think. I'll be glad to hear from you. Otherwise happy trading :-)

Rites📢breakout stock📢
🫸 Wait for the Retest 🫷
These are swing ideas which you can add your watchlist and analysis for yourself !
Keep on your radar!
This content only education purpose!
❗I am not sebi ragister❗

RITES go long ifit crosses 525.70
entry @ 525.75
stop loss: 470.95 (10.42% risk involved)
target: 635.10 (20.80% reward with a risk of 10.42%)
buy this stock only one can handle risk of 10.42%
this is my stock idea and i am entering in it with 10.42% risk, if one cannot handle 10.42% risk please do not enter into it.
I am no SEBI registered individual , please do your own analysis before entering into it.


RITES LTD Setting up nicely forming a base with low volumes on selling and making inverse H&S buy above pivot with sl of swing low

RitesThe company is the only export arm of Indian Railways for providing rolling stock overseas (other than Thailand, Malaysia and Indonesia)
Looking very good as it breaks out of the gann levels and also one of the most undervalued and fundamentally decent stocks of the railway sector

Short Term View on Rites A short term bullish view on Rites.
View only for education purpose.
1 Month duration
update on RITES ltd.This is an update of my previous idea on RITES LTD. with 3rd wave and 4th complete according to Elliot Wave RITES LTD. looks ready to continue its upmove, one can hold RITES with the above trend line as trailing SL or can make new position with trend line as SL

RITES LTD. A MULTIBAGGER HAPPENINGhello, in this idea I would like to show you rites ltd. In my opinion, Rites will be moving along the drawn Elliot waves and will probably reach 800 in mid-term for about 1.5 years. And in long-term this stock can easily multiply upto 3 times.

Reverse Triangle Pattern: RITESA reverse triangle pattern is similar to a traditional triangle pattern, but with one key difference: the nose of the triangle points downwards, indicating a period of selling pressure. This type of formation can be used to identify potential areas of support and resistance, and even predict future price movements.
As the price broke multiple level of resistance, STOP LOSS is very important for this trade.
Reverse triangle patterns are a valuable tool for traders and investors alike, allowing them to identify potential areas of support and resistance and even predict future price movements. By understanding how to identify and use these patterns effectively, you can gain a competitive edge in the markets and make more informed trading decisions. Thanks for reading, and happy trading!
