Confirmed Breakout and Retest of Channel Resistance.Entry Zone: We recommend accumulating Rolex Rings Ltd. in the zone of ₹1,460 - ₹1,500. This area represents a crucial retest of the broken descending channel's resistance, now acting as strong support.
Target 1 (T1): ₹1,580
Target 2 (T2): ₹1,650
Target 3 (T3): ₹1,750 (Extended target if momentum remains strong)
Stop Loss (SL): ₹1,400 (Strictly on a daily closing basis)
Rationale:
Clear Channel Breakout: The stock has executed a textbook breakout from a well-defined multi-month descending channel. This indicates a significant shift in the underlying trend from bearish to bullish.
Successful Retest: Post-breakout, the price has pulled back to retest the upper boundary of the channel, which is a classic technical confirmation of a valid breakout. The retest appears to be holding, suggesting the former resistance has turned into reliable support.
Volume Confirmation: The initial breakout was supported by decent volumes, and the current consolidation/retest phase is occurring on relatively lower volumes, which is typical before the next leg up.
RSI Bullish Momentum: The Relative Strength Index (RSI) is maintaining its position above the 50-mark and shows bullish bias, supporting the upward price momentum.
Favorable Risk-Reward: The current entry point offers an attractive risk-reward profile for a short-term trade, with the potential upside significantly outweighing the downside risk defined by the stop-loss.
Key Risk: A decisive daily closing below ₹1,400 would invalidate the bullish breakout and retest pattern, suggesting a false breakout or a resumption of the downtrend. Strict adherence to the stop-loss is advised.
Disclaimer : This report is for informational purposes only and does not constitute financial advice. Investors should conduct their own due diligence and consult with a qualified financial advisor before making any investment decisions. Equity investments are subject to market risks.
For Education purposes only
ROLEXRINGS trade ideas

Investment Pick : ROLEX RINGSThis idea is just for educational purpose and it's not any buying or selling signal.

Rolex Rings Ready for Takeoff: Long Trade Targets ₹2741!Rolex Rings on the 4-hour timeframe is presenting a fresh long trade opportunity, with the price currently hovering around the entry level. This setup, identified using the Risological Swing Trading Indicator, is primed for a strong upward move targeting 2741.60 at TP4.
Rolex Rings Key Levels:
TP1: 2267.90
TP2: 2448.85
TP3: 2629.80
TP4: 2741.60
Technical Analysis:
The entry price is set at 2156.05, with a stop-loss at 2065.55, ensuring effective risk management.
The price recently broke through a significant resistance zone, signaling bullish momentum. With the Risological trend line confirming the upward bias, this trade setup offers a high-reward opportunity for traders looking to capitalize on the next potential rally.
Namaste!

ROLEX RINGS LTD S/RSupport and Resistance Levels:
Support Levels: These are price points (green line/shade) where a downward trend may be halted due to a concentration of buying interest. Imagine them as a safety net where buyers step in, preventing further decline.
Resistance Levels: Conversely, resistance levels (red line/shade) are where upward trends might stall due to increased selling interest. They act like a ceiling where sellers come in to push prices down.
Breakouts:
Bullish Breakout: When the price moves above resistance, it often indicates strong buying interest and the potential for a continued uptrend. Traders may view this as a signal to buy or hold.
Bearish Breakout: When the price falls below support, it can signal strong selling interest and the potential for a continued downtrend. Traders might see this as a cue to sell or avoid buying.
20 EMA (Exponential Moving Average):
Above 20 EMA(50 EMA): If the stock price is above the 20 EMA, it suggests a potential uptrend or bullish momentum.
Below 20 EMA: If the stock price is below the 20 EMA, it indicates a potential downtrend or bearish momentum.
Trendline: A trendline is a straight line drawn on a chart to represent the general direction of a data point set.
Uptrend Line: Drawn by connecting the lows in an upward trend. Indicates that the price is moving higher over time. Acts as a support level, where prices tend to bounce upward.
Downtrend Line: Drawn by connecting the highs in a downward trend. Indicates that the price is moving lower over time. It acts as a resistance level, where prices tend to drop.
RSI: RSI readings greater than the 70 level are overbought territory, and RSI readings lower than the 30 level are considered oversold territory.
Combining RSI with Support and Resistance:
Support Level: This is a price level where a stock tends to find buying interest, preventing it from falling further. If RSI is showing an oversold condition (below 30) and the price is near or at a strong support level, it could be a good buy signal.
Resistance Level: This is a price level where a stock tends to find selling interest, preventing it from rising further. If RSI is showing an overbought condition (above 70) and the price is near or at a strong resistance level, it could be a signal to sell or short the asset.
Disclaimer:
I am not a SEBI registered. The information provided here is for learning purposes only and should not be interpreted as financial advice. Consider the broader market context and consult with a qualified financial advisor before making investment decisions.

ROLEX RINGS - 🎯The chart is pretty self-explanatory as always.
Just a Note: The chart is on weekly TF. We will Wait for the Weekly Candle Close
⚠️Disclaimer: We are not registered advisors. The views expressed here are merely personal opinions. Irrespective of the language used, Nothing mentioned here should be considered as advice or recommendation. Please consult with your financial advisors before making any investment decisions. Like everybody else, we too can be wrong at times

Just a Born babyhi @JainArpan
These are new type of scripts, what will I tell you in these , I don't Know about any Fundamentals and as well I am also not interested in them, So please...
some few levels to watch out if holds base.
All the best.
Gratify if you appreciate the practice then you can like it, share it and
If you want me to investigate any chart for you then would cherish doing that for you.
Thank you for your time and support.
Stay safe.

💥Rolex Rings💥-Nice Breakout💥Rolex Rings💥-Nice Breakout
Capital to be deployed- 20k
Investing Price-2420-2440
Breakout Price-2407
Stoploss-2105
Targets-3598
RT for max reach
#rolexrings #stockstowatch #StocksToBuy #StocksInFocus #stocks #StockMarket

Rolex seems to be good breakout#ROLEXRINGS
#ROLEX
Took long entry at 2430
stock seems to be good.
Stop loss will be days low.
#vr


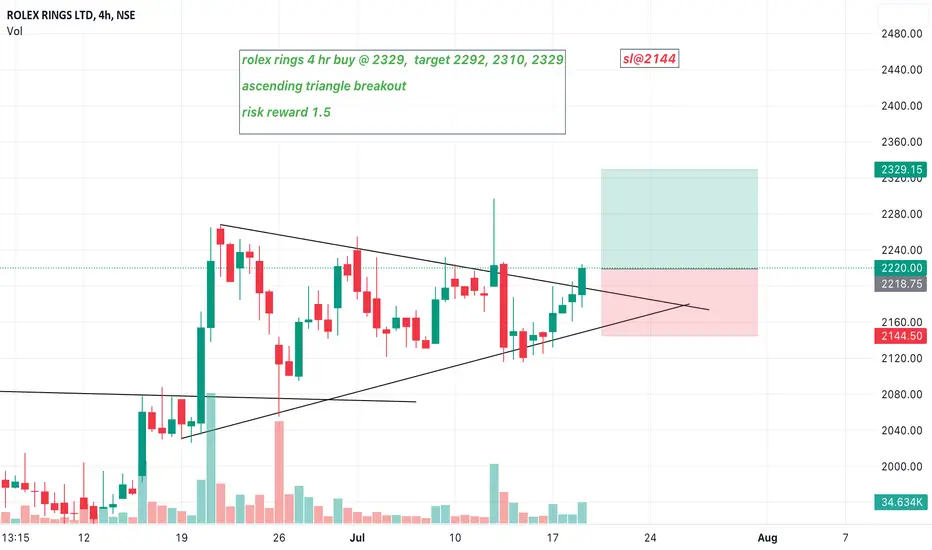
rolex rings 4 hr buy @ 2329, target 2292, 2310, 2329 ascendingrolex rings 4 hr buy @ 2329, target 2292, 2310, 2329
ascending triangle breakout
risk reward 1.5
sl@2144
Rolex Rings Breakout retestRolex rings doing breakout retest attempt.
Will wait for a good candle to take confirmation and entry.

ROLEX RINGSIt is all time high now. the price may consolidate here. after this there may be gud upside target. wait for price to make some consolidation here. then buy sl will FAT green candle low. for swing trade. target also big. atleast 2700 will be target here.

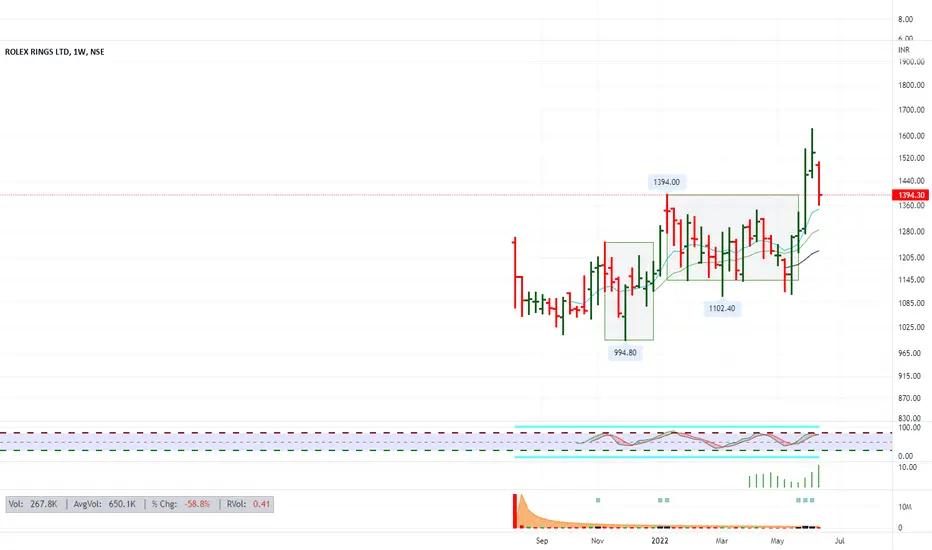
ROLEXRINGS - Weekly AnalysisIn the Weekly Chart of ROLEXRINGS ,
we can see that, it is forming a Cup & Handle Patter.
Possibilities are shown in chart.
Lets see what move it takes.

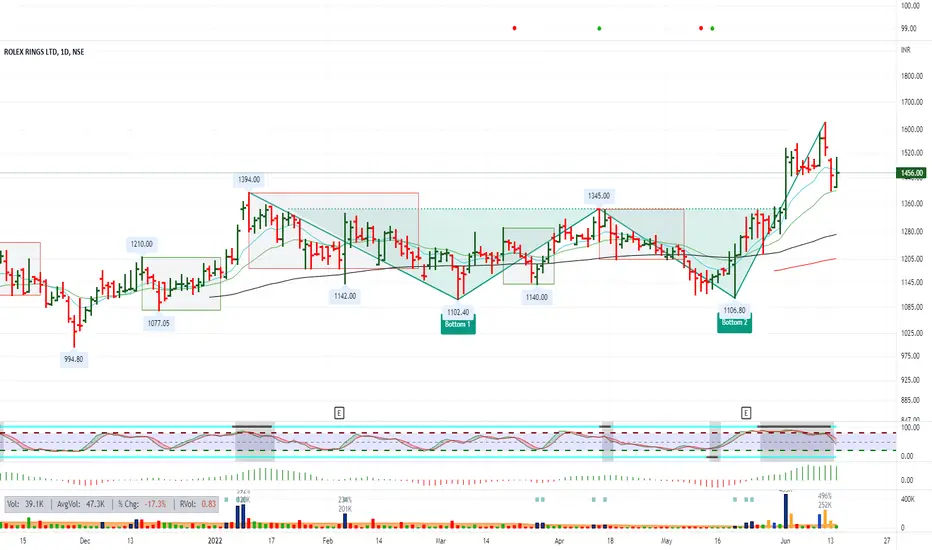
ROLEXRINGS - Bullish Swing ReversalNSE: ROLEXRINGS is closing with a bullish swing reversal candle.
Today's candlestick formation indicates strong demand and stock should move to previous swing highs in the coming days.
The stock has been consolidating for the past few days which is indicating demand.
One can look for a 8% to 12% gain on deployed capital in this swing trade.
The view is to be discarded in the event of the stock breaking previous swing low.
#NSEindia #Trading #StockMarketindia #Tradingview #SwingTrade
Disclaimer:
This is for educational purposes only.

Rolex RingsRolex Rings breaking out of Box.
But usually it is large bar on breakout.
So watch for entry

CHANNEL BREAKOUT STRATEGY
This Stock has been travelling in a channel since it's listing.
It tried to breakout the resistance level once and it did, but that became fake out.
Now again it has again with a Good Breakout with increase in the volume
Now it's trading at All time High
Now the breakout has been retested and it's good to go and buy at ₹1620
Target ₹1880 in 5 to 10 trading days
Stoploss ₹1550

ROLEX RINGSBreakout and Retrace in Weekly chart.
STRONG CHART.
I plan to enter at week close and SL 1275 - 21 week average
Breakout Retrace in this market have to see if will work....
Rolex Rings#RolexRings
I think one of the few stocks that broke out and retrace category.
Tough to believe.
But keeping 1350 as SL i will enter with a small position.
Weekly chart looks good . At lest in my eyes.
Rolex Rings Limited - Breakout with highest ever volume.Rolex Rings Limited - Breakout with highest ever volume in the script. Investment Opportunity - Conservative investors can wait for pull back.

double breakoutshort term
entry :1550
target:2000
breakout from range and channel
use 50 ema to ride the trend

Rolex rings - bullish tradeRolex rings stock looks like ready to give a short term upswing trade if manages to close above the downward slopping channel. Targets are mentioned in the chart, stop loss could be the day candle low that breaks the channel.
Good luck.

ROLEX RINGS - VCP formation (IPO base)The tape has formed an IPO base.
Volume dries up as price compresses.
Tape is drifting sideways around 21 EMA.
Inside candles.
Pivot buy at 1194
SL below mother candle low @1130
Entering half qualtities at CMP 1170; rest half at buy-stop price of 1194 as having conviction that price will breakout from pivot, will exit if mother candle low is broken.
Publishing for my own reference.
Not an investment/trading advice.

ROLEX RING LTDROLEX RING LTD gave breakout on chart. Its should be in your watchlist. once Rolex Retest the breakout or consolidated above the breakout level its should be buying candidate.
