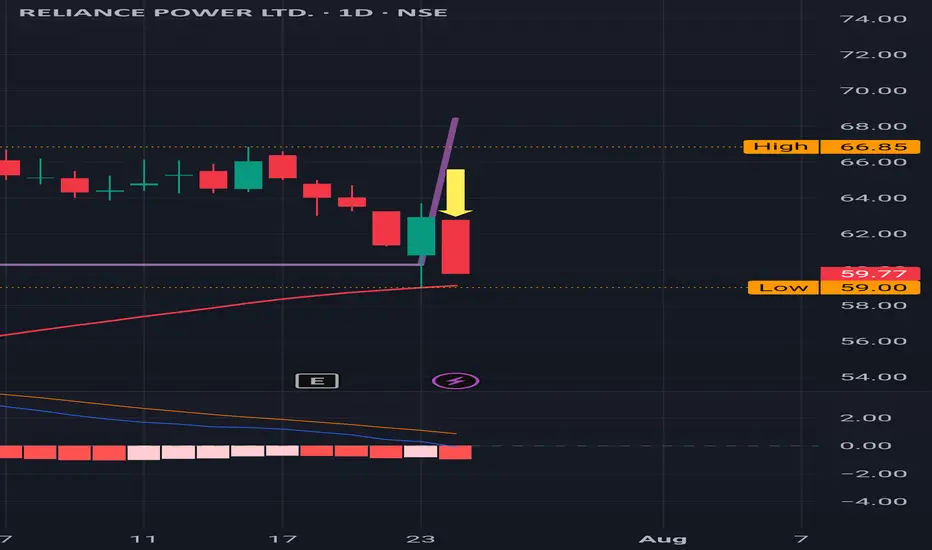
REL Power : Sell Signal Triggered REL Power : Sell Signal Triggered
( Not a Buy / Sell Recommendation
Do your own due diligence ,Market is subject to risks, This is my own view and for learning only .)
7.69 INR
29.48 B INR
71.53 B INR
2.86 B
About RELIANCE POWER LTD.
Sector
Industry
CEO
Neeraj Parakh
Website
Headquarters
Mumbai
Founded
1995
ISIN
INE614G01033
FIGI
BBG000THGS92
Reliance Power Ltd. develops, constructs and operates power projects both in India and internationally. Its business projects areas include coal, gas, solar power, hydroelectricity, wind power, renewable energy and carbon credits. The company was founded by Dhirubhai Hirachand Ambani on January 17, 1995 and is headquartered in Mumbai, India.
Related stocks
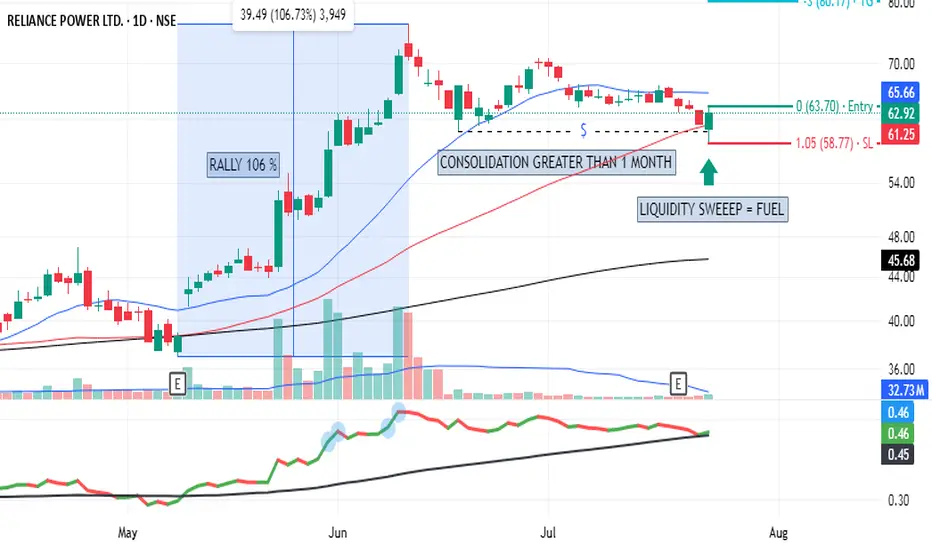
RPOWER - My Pick - No AdviceRally of 106% followed by consolidation of more than a month and fueled by liquidity today. Do I need to say more ? Chart says it all....
follow proper risk management. Investment in stock market is Risky.
REL Power : Hit the support of 50 as mentioned earlier REL Power : Hit the support of 50 as mentioned in the earlier post
( Not a Buy / Sell Recommendation
Do your own due diligence ,Market is subject to risks, This is my own view and for learning only .)

REL Power : It has to clear the Red band Resistance REL Power : It has to clear the Red band Resistance to move forward.
This is 3M Time Frame.
( Not a Buy / Sell Recommendation
Do your own due diligence ,Market is subject to risks, This is my own view and for learning only .)

REL Power : Feeling the resistance , couldn't sustain above it REL Power : Feeling the resistance , couldn't sustain above it and got a pulled back
This is 3 months Time frame .
( Not a Buy / Sell Recommendation
Do your own due diligence ,Market is subject to risks, This is my own view and for learning only .)

Cup & handle Breakout - RPOWERCurrent Price: ₹71
Technical Analysis:
Cup & Handle Breakout Pattern: The provided chart for RPOWER shows a pattern that resembles a Cup & Handle, and it appears to be currently breaking out or is near a breakout point.
Waiting for Confirmation: Your statement "Waiting for confirmation" is crucia

REL Power : Fantastic rally after a buy signal in March 2025 REL Power : Fantastic rally after a buy signal in the last week of March 2025 after few initial hiccups. From 40 to now at 70.
It got momentum mainly from the last week of May 2025 .
( Not a Buy / Sell Recommendation
Do your own due diligence ,Market is subject to risks, This is my own vi

REL Power : Crossed the major resistance and sitting just above REL Power : Crossed the major resistance and sitting just above it at 70.
Hopefully it sustains there .
(This is 3 Month time frame )
-------------
On a Monthly time frame it has just surpassed 200 SMA which also an important milestone.
( Not a Buy / Sell Recommendation
Do your own due dil

#RPOWER - MONTHLY LEVELS | 24.83 or 72.68?Date: 27-05-2025
#RPOWER Current Price: 52.04
Mid-Point: 48.75
#RPOWER Upside Levels: 59.76, 66.15, 72.68 and 79.20
#RPOWER Downside Levels: 37.76, 31.35, 24.83 and 18.30
Support: 44.18
Resistance: 53.37
#RPOWERChart

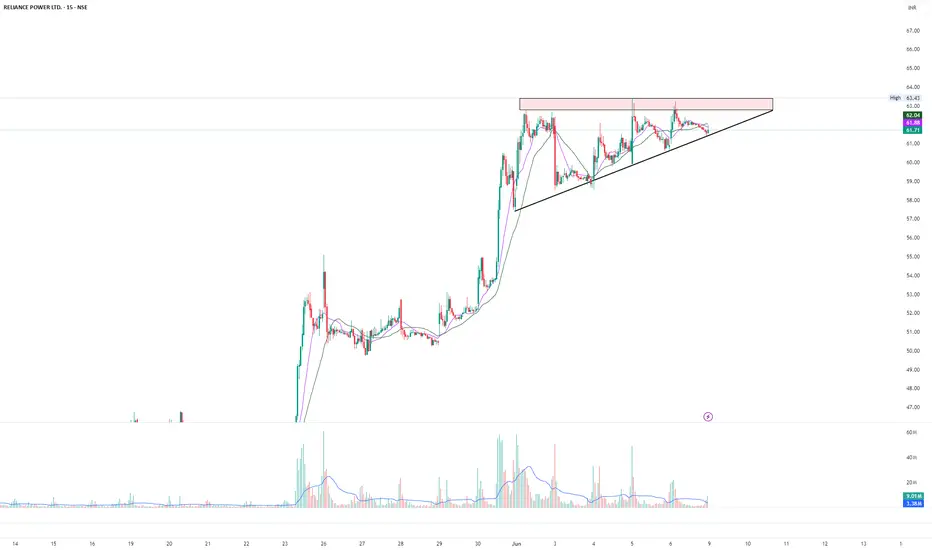
Ascending triangle in RPOWEROn short term chart, Rpower has created ascending triangle. This is after stock has moved up with a higher relative volume. This triangle suggests consolidation of upmove and further movement is highly probable.
As you can see, volume on up bars is huge as compared to down bars. This suggests highe
See all ideas
Summarizing what the indicators are suggesting.
Oscillators
Neutral
SellBuy
Strong sellStrong buy
Strong sellSellNeutralBuyStrong buy
Oscillators
Neutral
SellBuy
Strong sellStrong buy
Strong sellSellNeutralBuyStrong buy
Summary
Neutral
SellBuy
Strong sellStrong buy
Strong sellSellNeutralBuyStrong buy
Summary
Neutral
SellBuy
Strong sellStrong buy
Strong sellSellNeutralBuyStrong buy
Summary
Neutral
SellBuy
Strong sellStrong buy
Strong sellSellNeutralBuyStrong buy
Moving Averages
Neutral
SellBuy
Strong sellStrong buy
Strong sellSellNeutralBuyStrong buy
Moving Averages
Neutral
SellBuy
Strong sellStrong buy
Strong sellSellNeutralBuyStrong buy
Displays a symbol's price movements over previous years to identify recurring trends.
Frequently Asked Questions
The current price of RPOWER is 47.58 INR — it has decreased by −5.01% in the past 24 hours. Watch RELIANCE POWER LTD. stock price performance more closely on the chart.
Depending on the exchange, the stock ticker may vary. For instance, on NSE exchange RELIANCE POWER LTD. stocks are traded under the ticker RPOWER.
RPOWER stock has fallen by −13.49% compared to the previous week, the month change is a −26.29% fall, over the last year RELIANCE POWER LTD. has showed a 47.53% increase.
RPOWER reached its all-time high on Feb 11, 2008 with the price of 331.25 INR, and its all-time low was 1.00 INR and was reached on Mar 26, 2020. View more price dynamics on RPOWER chart.
See other stocks reaching their highest and lowest prices.
See other stocks reaching their highest and lowest prices.
RPOWER stock is 5.28% volatile and has beta coefficient of 2.19. Track RELIANCE POWER LTD. stock price on the chart and check out the list of the most volatile stocks — is RELIANCE POWER LTD. there?
Today RELIANCE POWER LTD. has the market capitalization of 207.66 B, it has increased by 2.32% over the last week.
Yes, you can track RELIANCE POWER LTD. financials in yearly and quarterly reports right on TradingView.
RPOWER net income for the last quarter is 446.80 M INR, while the quarter before that showed 1.26 B INR of net income which accounts for −64.42% change. Track more RELIANCE POWER LTD. financial stats to get the full picture.
No, RPOWER doesn't pay any dividends to its shareholders. But don't worry, we've prepared a list of high-dividend stocks for you.
As of Aug 4, 2025, the company has 8.28 K employees. See our rating of the largest employees — is RELIANCE POWER LTD. on this list?
EBITDA measures a company's operating performance, its growth signifies an improvement in the efficiency of a company. RELIANCE POWER LTD. EBITDA is 20.23 B INR, and current EBITDA margin is 43.15%. See more stats in RELIANCE POWER LTD. financial statements.
Like other stocks, RPOWER shares are traded on stock exchanges, e.g. Nasdaq, Nyse, Euronext, and the easiest way to buy them is through an online stock broker. To do this, you need to open an account and follow a broker's procedures, then start trading. You can trade RELIANCE POWER LTD. stock right from TradingView charts — choose your broker and connect to your account.
Investing in stocks requires a comprehensive research: you should carefully study all the available data, e.g. company's financials, related news, and its technical analysis. So RELIANCE POWER LTD. technincal analysis shows the strong sell today, and its 1 week rating is sell. Since market conditions are prone to changes, it's worth looking a bit further into the future — according to the 1 month rating RELIANCE POWER LTD. stock shows the buy signal. See more of RELIANCE POWER LTD. technicals for a more comprehensive analysis.
If you're still not sure, try looking for inspiration in our curated watchlists.
If you're still not sure, try looking for inspiration in our curated watchlists.