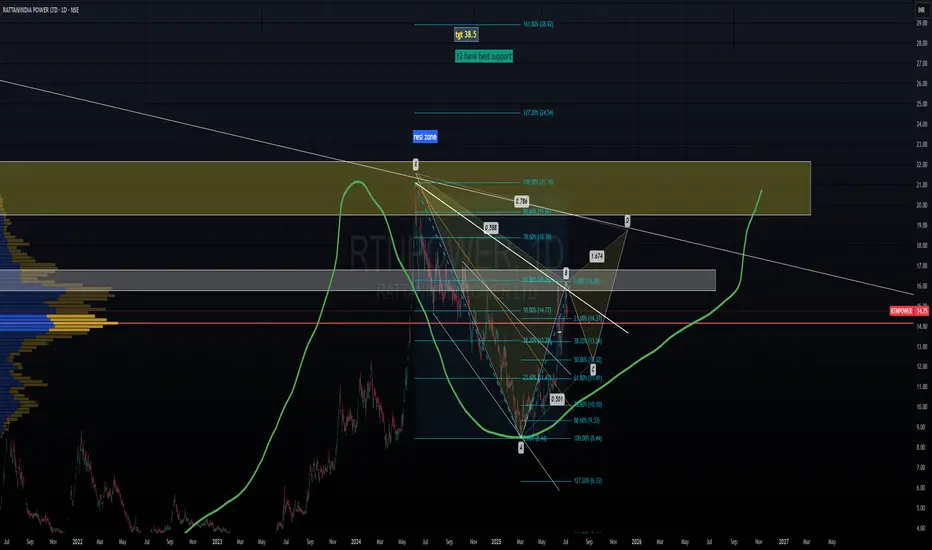
rtn power looks bull after some bearishnessrtn power may makes harminc pattern, if possible it, it will reach pont d target, means 12.5 to 18 around.
RTNPOWER trade ideas
RATTANINDIA POWER LTD S/RSupport and Resistance Levels:
Support Levels: These are price points (green line/shade) where a downward trend may be halted due to a concentration of buying interest. Imagine them as a safety net where buyers step in, preventing further decline.
Resistance Levels: Conversely, resistance levels (red line/shade) are where upward trends might stall due to increased selling interest. They act like a ceiling where sellers come in to push prices down.
Breakouts:
Bullish Breakout: When the price moves above resistance, it often indicates strong buying interest and the potential for a continued uptrend. Traders may view this as a signal to buy or hold.
Bearish Breakout: When the price falls below support, it can signal strong selling interest and the potential for a continued downtrend. Traders might see this as a cue to sell or avoid buying.
20 EMA (Exponential Moving Average):
Above 20 EMA(50 EMA): If the stock price is above the 20 EMA, it suggests a potential uptrend or bullish momentum.
Below 20 EMA: If the stock price is below the 20 EMA, it indicates a potential downtrend or bearish momentum.
Trendline: A trendline is a straight line drawn on a chart to represent the general direction of a data point set.
Uptrend Line: Drawn by connecting the lows in an upward trend. Indicates that the price is moving higher over time. Acts as a support level, where prices tend to bounce upward.
Downtrend Line: Drawn by connecting the highs in a downward trend. Indicates that the price is moving lower over time. It acts as a resistance level, where prices tend to drop.
RSI: RSI readings greater than the 70 level are overbought territory, and RSI readings lower than the 30 level are considered oversold territory.
Combining RSI with Support and Resistance:
Support Level: This is a price level where a stock tends to find buying interest, preventing it from falling further. If RSI is showing an oversold condition (below 30) and the price is near or at a strong support level, it could be a good buy signal.
Resistance Level: This is a price level where a stock tends to find selling interest, preventing it from rising further. If RSI is showing an overbought condition (above 70) and the price is near or at a strong resistance level, it could be a signal to sell or short the asset.
Disclaimer:
I am not a SEBI registered. The information provided here is for learning purposes only and should not be interpreted as financial advice. Consider the broader market context and consult with a qualified financial advisor before making investment decisions.

Buy : Buy signal has triggered for Rattanpower Buy Signal has triggered for RattanPowee
MACD : Positive Crossover with one already touching 0
Green strong candle closed above Super trend , 200 SMA ,69 Low EmA
Resistance at 21

rtn power, fully chargedFor the past three financial years, RattanIndia has demonstrated a healthy track record of generation and offtake.
Its plant availability factor (PAF) was 81% in FY 2023 (86% in FY 2022) leading to healthy recovery of fixed cost.
Plant load factor (PLF) for the plant also improved to 77% in FY 2023 from 75% in FY 2022, driven by higher demand from MSEDCL (Maharashtra State Electricity Distribution Co. Ltd). This has led to optimum recovery of variable energy charges as well.
The company has a 25-year PPA (till 2040) with MSEDCL for almost its entire net capacity, which reduces offtake risk and provides revenue visibility.
The tariff structure allows the company to recover its entire fixed cost, provided the plant achieves a normative PAF of 85%.
Additionally, the plant has adequate fuel linkage for its coal requirement driven by FSA with SECL for 6.1 metric tonne per annum (MTPA).
Moreover, in case of further requirement or unavailability, the plant may procure coal from other alternate sources, contingent on requisite approvals, which allows it to show availability and recover fixed energy charges.

RTN POWER longStock is in the accumulation phase, and it gains a high volume. The volume shrinks at the pullback. However, It caught my eye when the stock broke the weekly support, and I assume it was done purposely to stop losses retailers

Rattan power for short and long term.👉Short term target 20✅
👉Long term target 29✅
Confirmation 👇
High breakout volume ✅
@ kindly consider your financial advisor before taking any position, I am not SEBI registered.

POWER SURGEPOWER SURGE IN THE STOCK ITSELF currently at resistance levels, after years of downtrend looks to be getting back into momentum, similar pattern for JPPower as well.

RTN Power is trading above trendline and forming a good baseRTN Power broke above trendline and form a good base with a reversal signal, good to keep in watch list. Volumes are increasing, very high probability of good upside potential.
Note: Please consult your financial advisor before making any investments.
STOCK TRADING IS INHERENTLY RISKY AND THE USERS AGREE TO ASSUME COMPLETE AND FULL RESPONSIBILITY FOR THE OUTCOMES OF ALL TRADING

RTNPOWER looks bullishRTNPOWER popped up on RSI breakout screener results
A few highlights
Increasing volume when breaking the neckline level 9
There was strong resistance at level 9, failed attempts four times
Rounding bottom
There is no resistance if it breaks its all-time high of 13.50
RSI above 60 on a monthly, weekly and daily time frame is a vital sign
Even if we set stop loss below the previous swing low, we can comfortably achieve a risk-to-reward ratio of over two. Good trade for the short-term.
If the trend continues after retesting the neck level 9, we may see 17 levels shortly. The depth of the cup is the target from the neckline.

💥Rattan India Power💥-Nice Breakout💥Rattan India Power💥-Nice Breakout
Capital to be deployed- 20k
Investing Price -7.60
Breakout Price -7
Stoploss-5
Targets-15-31
RT for max reach
#rattanindiapower #StocksToBuy #stocks #StocksToTrade #StocksInFocus #stockstowatch #StocksInNews #SwingTrading #BREAKOUTSTOCKS

RTNPOWER looks bullishRTNPOWER is looking bullish on weekly and monthly time frames. It has crossed 60 RSI levels on monthly and weekly time frames. You can see volume has been increasing recently. It has been forming a rounding bottom pattern. It is steaming off at 7 levels & getting ready for the next upside move. One can trade for 1:2 risk-to-reward ratio with the current scenario.

RATTAN INDIA POWER - WEEKLY TIME FRAMEThe Structure looks good to us, waiting for this instrument to correct and then give us these opportunities as shown on this instrument (Price Chart).
Note: Its my view only and its for educational purpose only. Only who has got knowledge about this strategy, will understand what to be done on this setup. its purely based on my technical analysis only (strategies). we don't focus on the short term moves, we look for only for Bullish or Bearish Impulsive moves on the setups after a good price action is formed as per the strategy. we never get into corrective moves. because it will test our patience and also it will be a bullish or a bearish trap. and try trade the big moves.
we do not get into bullish or bearish traps. We anticipate and get into only big bullish or bearish moves (Impulsive Moves). Just ride the Bullish or Bearish Impulsive Move. Learn & Know the Complete Market Cycle.
Buy Low and Sell High Concept. Buy at Cheaper Price and Sell at Expensive Price.
Keep it simple, keep it Unique.
please keep your comments useful & respectful.
Thanks for your support....
Tradelikemee Academy

RATTAN INDIA POWER - WEEKLY TIME FRAMEThe Structure looks good to us, waiting for this instrument to correct and then give us these opportunities as shown on this instrument (Price Chart).
Note: its my view only and its for educational purpose only. only who has got knowledge about this strategy, will understand what to be done on this setup. its purely based on my technical analysis only (strategies). we don't focus on the short term moves, we look for only for Bullish or Bearish Impulsive moves on the setups after a good price action is formed as per the strategy. we never get into corrective moves. because it will test our patience and also it will be a bullish or a bearish trap. and try trade the big moves.
we do not get into bullish or bearish traps. we anticipate and get into only big bullish or bearish moves (Impulsive moves).
Just ride the bullish or bearish impulsive move. Learn & Know the Complete Market Cycle.
buy low and sell high concept. buy at cheaper price and sell at expensive price.
Keep it simple, keep it Unique.
please keep your comments useful & respectful.
Thanks for your support....

Penny Stock BlastAfter a long Consolidation it's ready to make blast
catch it or Watch it your choice !!😍

Ratan india powerI'm headling days of summer cruise fest from Miami to Bahamas June 28- July 1. Super Dope! Book you
Me and #boogie want you to hit us with your #silentridechallenge videos while we finish out this tour.. we'll both be reposting our favourites. Don't embarrass yourself. I'll be watching.
#eminem
Tickets are on sale now for the july 25th show at Cheyenne frontier days ....


RTNPOWER MAY FORM AN INV HEAD & SHOULDERS. ACCUMULATE RTNPOWER ON ALL DIPS. SOME SERIOUS BUYING HAPPENING BY THE PROMOTERS. AS GOVT WILL INCREASE SUBSIDY AND PLI SCHEMES, POWER SECTOR SHOULD BE HIGHLY BULLISH FOR ATLEAST 3/5 YEARS.
Long Term Targets Should be 12/15/20/24 and beyond.
Book Profis According To Your Risk Capacity.
This is only for educational purpose.
DO NOT ALLOCATE MORE THAN 5% OF YOUR PORTFOLIO.
DISC : NOT A SEBI REGISTERED ADVISOR.
STAY SAFE, HAPPY INVESTING :)
- JAINAM SHETH, RELITRADE.

RTNPOWER heading towards 11Its about to complete 4th wave and reverse for an upside first target of 11

Rattan India Power - LongRattan India Power CMP - 3.50
Looking bullish in higher time frame. However, it should go down for retracement and then move upward. One can go for Short Term Trade setup with the following entry, exit & targets
Buy Range 3.35 - 3.40 / Stop Loss 2.30
Target 1 - 4.40
Target 2 - 5.50
Target 3 - 7.50
Disclaimer: This is my view and for educational purpose only.


