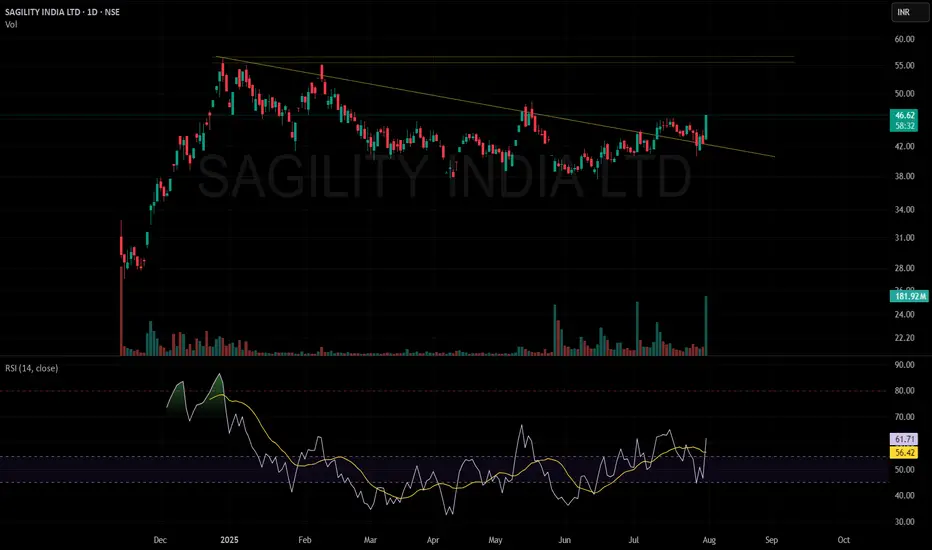
SAGILITY breakoutSAGILITY INDIA LTD
Technical Analysis Overview
Breakout Confirmation: The stock has convincingly broken out above a long-term descending trendline, accompanied by a sharp 9.98% surge in price and a significant jump in trading volume (181.83M). This combination of price action and volume generally indicates strong bullish sentiment and marks a potential trend reversal or fresh upward leg.
Volume Analysis: The highest volume day on the chart aligns with the breakout, suggesting institutional or large participant buying. Sustained higher volumes on up days after consolidations like this often provide additional confirmation of a genuine breakout rather than a false move.
RSI Momentum: The Relative Strength Index (RSI) is at 61.71, displaying strong bullish momentum yet leaving room before entering the overbought zone (typically above 70). This suggests there may still be scope for further upside without being immediately at risk of a major reversal due to overextension.
Trend Structure: After a consolidation phase and repeated attempts at the trendline, the price has managed to close decisively above resistance, indicating that the sellers may be getting exhausted and buyers are now in control.
Strategy & Key Levels
Watch for Retest: A pullback or retest towards the breakout trendline (around the 43-44 level) could present a buying opportunity if the level holds as new support.
Next Resistance Zones: Immediate resistance can be expected at previous swing highs, notably in the 50-55 range, where the stock faced prior selling pressure.
Risk Management: Any sustained move back below the breakout trendline would warrant caution, as it could indicate a failed breakout.
Summary
This breakout, backed by strong volume and improving RSI, indicates a shift in market sentiment in favor of buyers. Keeping an eye on price action around the breakout area and monitoring volume on any pullbacks will be key to validating the strength of this move.
SAGILITY trade ideas
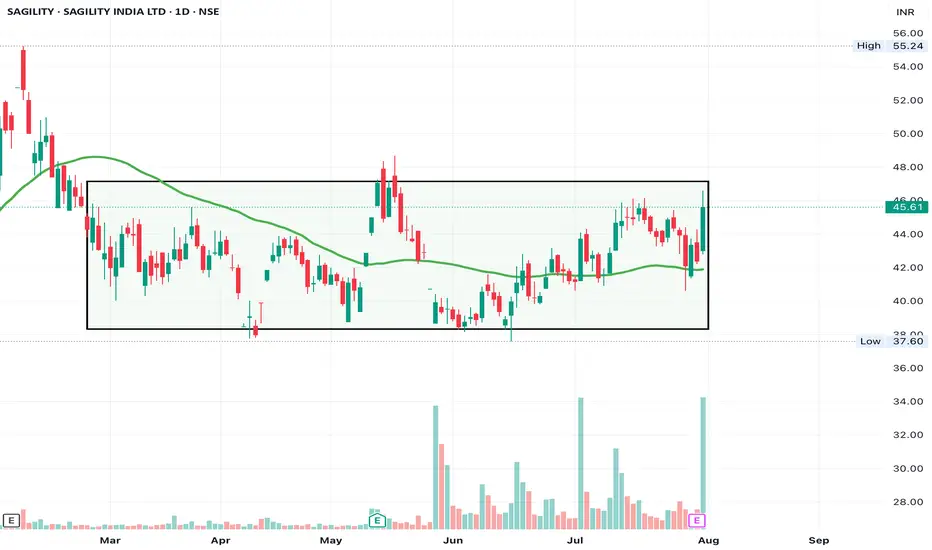
SAGILITY - Base FormationGood base formation happening right at 50 DMA in SAGILITY
I like the volumes that have come in today.
Relative strength line needs improvement, lets' see when this breakouts out
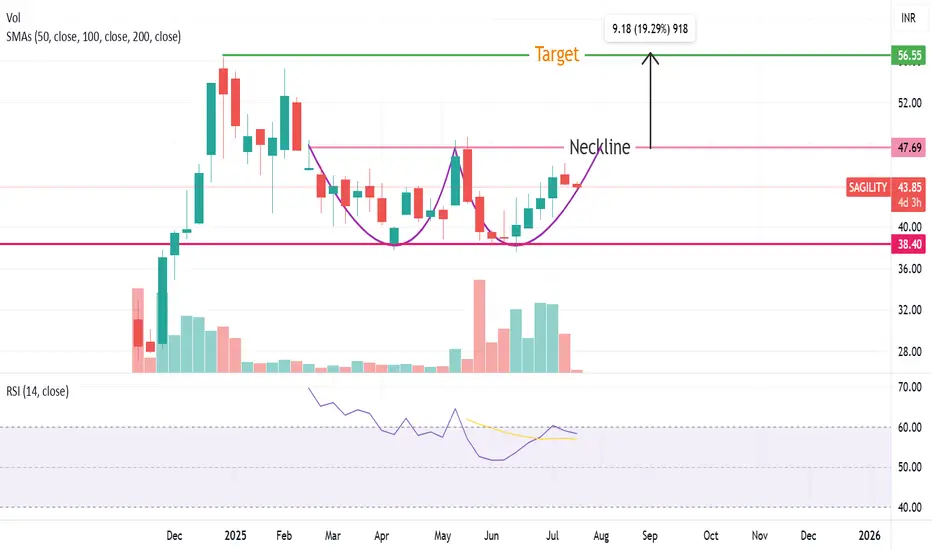
Sagility India ,Double Bottom Pattern formation going onSagility India, Forming Double Bottom pattern. Breakout of this pattern will be above 47 level .
Target price will be arround 56 with a stoploss of 40 rs .One can accumulate the stock at current price.
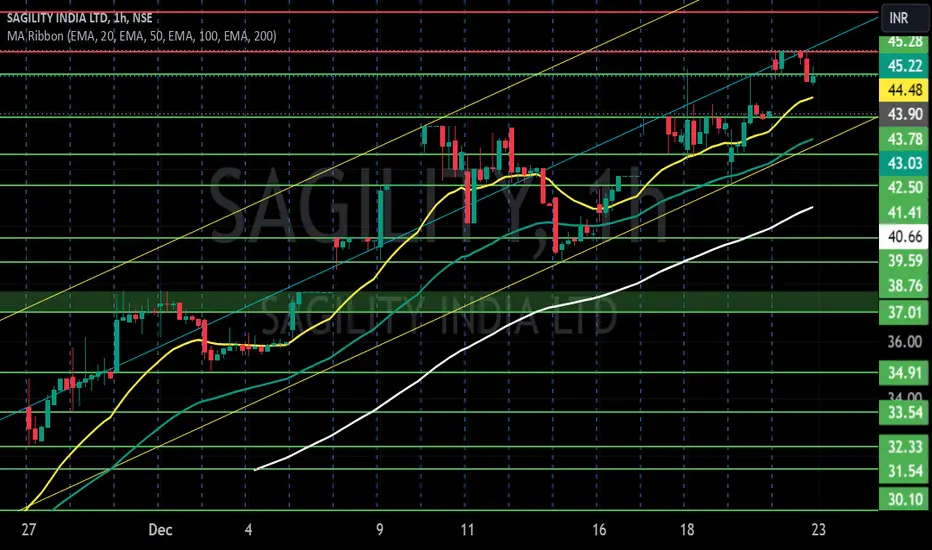
SAGILITY 1D📈 Current Technical & Market Overview
Stock price: ₹43.95 – ₹44 range, with significant trading volumes (~38 million shares)
TradingView
+15
Moneycontrol
+15
The Economic Times
+15
52‑week range: ₹27.02 (low) to ₹56.40 (high – all‑time high)
Investing.com
+2
Investing.com
+2
ICICI Direct
+2
The stock is trading above all its key moving averages (5/20/50/100/200‑day), signaling strong bullish momentum
MarketsMojo
+1
The Economic Times
+1
🔍 Analyst Forecasts
TradingView consensus: ₹59 target (min ₹54, max ₹64)
Munafasutra
+3
TradingView
+3
Screener
+3
TipRanks consensus: ₹58.33 average target — ~33% upside
TipRanks
+1
Munafasutra
+1
AlphaSpread (Wall Street): Average ₹61.2, high-end ₹74.55 — suggesting up to ~68% upside
INDmoney consensus: ₹58.33 target — ~36% upside
Investing.com India
+10
Indmoney
+10
Trendlyne
+10
📰 Recent Events & Concerns
On May 27, 2025, promoter initiated a large stake sale (~₹2,671 Cr) via Offer For Sale, pushing the stock down ~5% to ₹40.70
Investing.com
+2
Investing.com India
+2
The Economic Times
+2
While this added short-term selling pressure, analysts remain optimistic given long-term fundamentals.
🧭 Outlook & Will It Break Its All‑Time High?
Technical strength: Strong upward trend and sustained high volumes – bullish short-to-mid term
Analyst price targets clustering in the ₹58–₹61 range: this would surpass the current high (~₹56), potentially setting a new all-time high.
Recent dip due to promoter selling is likely a short-term event, with support around ₹40–₹42 based on price history.
✅ Summary
Yes, Sagility India is showing strong signs of breaking its previous all-time high (~₹56).
Consensus analyst targets (~₹58–₹61+) imply room to run ~30–38% higher from current levels.
Risks remain: watch for promoter actions, macroeconomic changes, or sector-specific news.
🔎 What You Can Do Now
Watch support levels: ₹40–₹42 is a key short-term support zone.
Set target range: Entry near ₹44, aim for ₹58–₹60.
Monitor volumes & moving averages—continued high volumes above the 50/100 DMA would reinforce the uptrend.
Stay alert to news around promoter stake sale or earnings updates (Q1 performance expected soon).
Disclaimer: The information provided is for educational and informational purposes only and should not be considered as financial advice. Investing in the stock market involves risk, and past performance is not indicative of future results. Please consult with a certified financial advisor or conduct your own research before making any investment decisions. We are not responsible for any losses incurred as a result of using this information. Stock market investments are subject to market risks; read all related documents carefully.

SagilityThis stock is showing signs of a potential reversal on the weekly timeframe, based on Fibonacci retracement levels, and may move upwards.

SAGILITY INDIA LTD S/RSupport and Resistance Levels:
Support Levels: These are price points (green line/shade) where a downward trend may be halted due to a concentration of buying interest. Imagine them as a safety net where buyers step in, preventing further decline.
Resistance Levels: Conversely, resistance levels (red line/shade) are where upward trends might stall due to increased selling interest. They act like a ceiling where sellers come in to push prices down.
Breakouts:
Bullish Breakout: When the price moves above resistance, it often indicates strong buying interest and the potential for a continued uptrend. Traders may view this as a signal to buy or hold.
Bearish Breakout: When the price falls below support, it can signal strong selling interest and the potential for a continued downtrend. Traders might see this as a cue to sell or avoid buying.
MA Ribbon (EMA 20, EMA 50, EMA 100, EMA 200) :
Above EMA: If the stock price is above the EMA, it suggests a potential uptrend or bullish momentum.
Below EMA: If the stock price is below the EMA, it indicates a potential downtrend or bearish momentum.
Trendline: A trendline is a straight line drawn on a chart to represent the general direction of a data point set.
Uptrend Line: Drawn by connecting the lows in an upward trend. Indicates that the price is moving higher over time. Acts as a support level, where prices tend to bounce upward.
Downtrend Line: Drawn by connecting the highs in a downward trend. Indicates that the price is moving lower over time. It acts as a resistance level, where prices tend to drop.
Disclaimer:
I am not a SEBI registered. The information provided here is for learning purposes only and should not be interpreted as financial advice. Consider the broader market context and consult with a qualified financial advisor before making investment decisions.
SAGILITY INDIA LTD S/R for 2/12/24Support and Resistance Levels:
Support Levels: These are price points (green line/shade) where a downward trend may be halted due to a concentration of buying interest. Imagine them as a safety net where buyers step in, preventing further decline.
Resistance Levels: Conversely, resistance levels (red line/shade) are where upward trends might stall due to increased selling interest. They act like a ceiling where sellers come in to push prices down.
Breakouts:
Bullish Breakout: When the price moves above resistance, it often indicates strong buying interest and the potential for a continued uptrend. Traders may view this as a signal to buy or hold.
Bearish Breakout: When the price falls below support, it can signal strong selling interest and the potential for a continued downtrend. Traders might see this as a cue to sell or avoid buying.
MA Ribbon (EMA 20, EMA 50, EMA 100, EMA 200) :
Above EMA: If the stock price is above the EMA, it suggests a potential uptrend or bullish momentum.
Below EMA: If the stock price is below the EMA, it indicates a potential downtrend or bearish momentum.
Trendline: A trendline is a straight line drawn on a chart to represent the general direction of a data point set.
Uptrend Line: Drawn by connecting the lows in an upward trend. Indicates that the price is moving higher over time. Acts as a support level, where prices tend to bounce upward.
Downtrend Line: Drawn by connecting the highs in a downward trend. Indicates that the price is moving lower over time. It acts as a resistance level, where prices tend to drop.
Disclaimer:
I am not a SEBI registered. The information provided here is for learning purposes only and should not be interpreted as financial advice. Consider the broader market context and consult with a qualified financial advisor before making investment decisions.
