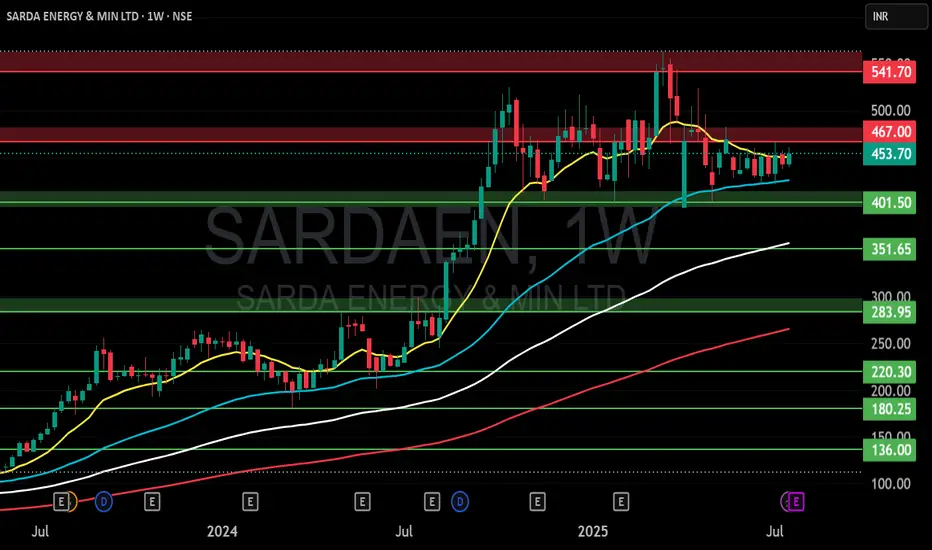
SARDA ENERGY & MIN LTD S/RSupport and Resistance Levels:
Support Levels: These are price points (green line/shade) where a downward trend may be halted due to a concentration of buying interest. Imagine them as a safety net where buyers step in, preventing further decline.
Resistance Levels: Conversely, resistance levels (re
Next report date
—
Report period
—
EPS estimate
—
Revenue estimate
—
19.85 INR
7.00 B INR
46.43 B INR
91.30 M
About SARDA ENERGY & MIN LTD
Sector
Industry
Website
Headquarters
Raipur
Founded
1973
ISIN
INE385C01021
FIGI
BBG000CYBF41
Sarda Energy & Minerals Ltd. is a holding company, which engages in the manufacture of sponge iron, ferro alloys, billet, wire-rod, and iron ore pellet. It operates through the following segments: Steel, Ferro, and Power. The company was founded on June 23, 1973 and is headquartered in Raipur, India.
Related stocks
SARDEAN1) Breakout with huge volume
2) retested support level
3) nifty 50 corrected but stock consolidates
a) SL 483
b) using supertrend 7, 2.5 on daily timeframe for trailing SL & target.

Sarda Energy & MineralsSarda Energy & Minerals looks like consolidating after the breakout. It has formed a tight flag. If it closes above 565 then it would be considered as a breakout. Weak below 525. This post is purely for educational purposes to learn the financial markets.
Disclaimer: I'm not a SEBI registered advis


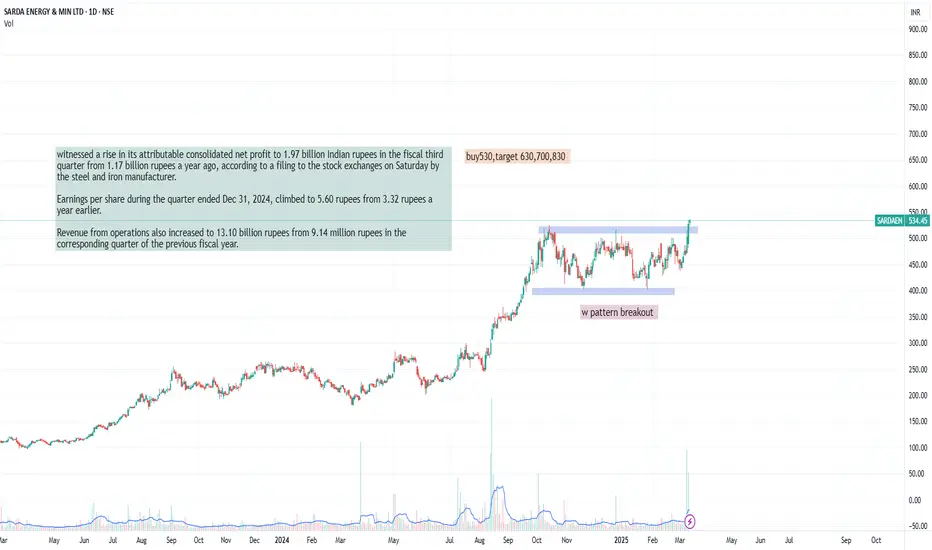
sarda energywitnessed a rise in its attributable consolidated net profit to 1.97 billion Indian rupees in the fiscal third quarter from 1.17 billion rupees a year ago, according to a filing to the stock exchanges on Saturday by the steel and iron manufacturer.
Earnings per share during the quarter ended Dec 31
Sarda Energy Sarda Energy is in range , signaling a potential breakout as its in a bullish pattern. One can look above 515 fr a new high.

SARDA ENERGY & MIN LTD ⚡ SARDA ENERGY & MIN LTD (NSE) - Breakout Watch! ⚡
📈 Symmetrical Triangle Pattern tightening—breakout loading?
🔍 Stock testing resistance near 52WH
✅ RS Rating: 97.7 | Alpha Signal: BUY
📊 Strong accumulation, momentum building!
Is this ready for a breakout move? Let’s discuss! 👇🔥
#Breakout #Sto

50 SMA Rising- Positional TradeDisclaimer: I am not a Sebi registered adviser.
This Idea is publish purely for educational purpose only before investing in any stocks please take advise from your financial adviser.
Its 50 SMA Rising Strategy. Suitable for Positional Trading Initial Stop loss lowest of last 2 candles and keep tra

Ascending triangle breakoutGood volume buildup in daily and weekly timeframe.
Highest volume buildup in past one year.
Ascending triangle breakout with good volume.
Depending on the market momentum the price cand give small retracement or move up.
Fundamental's are OK.
DII stakes are up.
NOTE: I do my analysis, do yours

SARDAEN - Sarda Energy & Minerals- Strong Bullish Momentum (Buy)Technical Analysis of SARDAEN - Sarda Energy & Minerals (SARDAEN):- Here's a breakdown of the technical analysis for SARDAEN:
Personal Opinion:- As per my technical analysis, I am Bullish in this stock and you can buy SARDAEN stock at CMP@274-290 or wait for a dip to enter in the buy trade.

See all ideas
Summarizing what the indicators are suggesting.
Oscillators
Neutral
SellBuy
Strong sellStrong buy
Strong sellSellNeutralBuyStrong buy
Oscillators
Neutral
SellBuy
Strong sellStrong buy
Strong sellSellNeutralBuyStrong buy
Summary
Neutral
SellBuy
Strong sellStrong buy
Strong sellSellNeutralBuyStrong buy
Summary
Neutral
SellBuy
Strong sellStrong buy
Strong sellSellNeutralBuyStrong buy
Summary
Neutral
SellBuy
Strong sellStrong buy
Strong sellSellNeutralBuyStrong buy
Moving Averages
Neutral
SellBuy
Strong sellStrong buy
Strong sellSellNeutralBuyStrong buy
Moving Averages
Neutral
SellBuy
Strong sellStrong buy
Strong sellSellNeutralBuyStrong buy
Displays a symbol's price movements over previous years to identify recurring trends.
Frequently Asked Questions
The current price of SARDAEN is 439.30 INR — it has decreased by −1.83% in the past 24 hours. Watch SARDA ENERGY & MIN LTD stock price performance more closely on the chart.
Depending on the exchange, the stock ticker may vary. For instance, on NSE exchange SARDA ENERGY & MIN LTD stocks are traded under the ticker SARDAEN.
SARDAEN stock has fallen by −1.95% compared to the previous week, the month change is a 0.62% rise, over the last year SARDA ENERGY & MIN LTD has showed a 61.75% increase.
SARDAEN reached its all-time high on Mar 19, 2025 with the price of 563.45 INR, and its all-time low was 7.10 INR and was reached on Aug 6, 2013. View more price dynamics on SARDAEN chart.
See other stocks reaching their highest and lowest prices.
See other stocks reaching their highest and lowest prices.
SARDAEN stock is 2.90% volatile and has beta coefficient of 0.81. Track SARDA ENERGY & MIN LTD stock price on the chart and check out the list of the most volatile stocks — is SARDA ENERGY & MIN LTD there?
Today SARDA ENERGY & MIN LTD has the market capitalization of 154.78 B, it has decreased by −3.98% over the last week.
Yes, you can track SARDA ENERGY & MIN LTD financials in yearly and quarterly reports right on TradingView.
SARDA ENERGY & MIN LTD is going to release the next earnings report on Aug 2, 2025. Keep track of upcoming events with our Earnings Calendar.
SARDAEN net income for the last quarter is 1.08 B INR, while the quarter before that showed 1.97 B INR of net income which accounts for −45.13% change. Track more SARDA ENERGY & MIN LTD financial stats to get the full picture.
Yes, SARDAEN dividends are paid annually. The last dividend per share was 1.00 INR. As of today, Dividend Yield (TTM)% is 0.23%. Tracking SARDA ENERGY & MIN LTD dividends might help you take more informed decisions.
EBITDA measures a company's operating performance, its growth signifies an improvement in the efficiency of a company. SARDA ENERGY & MIN LTD EBITDA is 12.30 B INR, and current EBITDA margin is 26.41%. See more stats in SARDA ENERGY & MIN LTD financial statements.
Like other stocks, SARDAEN shares are traded on stock exchanges, e.g. Nasdaq, Nyse, Euronext, and the easiest way to buy them is through an online stock broker. To do this, you need to open an account and follow a broker's procedures, then start trading. You can trade SARDA ENERGY & MIN LTD stock right from TradingView charts — choose your broker and connect to your account.
Investing in stocks requires a comprehensive research: you should carefully study all the available data, e.g. company's financials, related news, and its technical analysis. So SARDA ENERGY & MIN LTD technincal analysis shows the sell today, and its 1 week rating is sell. Since market conditions are prone to changes, it's worth looking a bit further into the future — according to the 1 month rating SARDA ENERGY & MIN LTD stock shows the buy signal. See more of SARDA ENERGY & MIN LTD technicals for a more comprehensive analysis.
If you're still not sure, try looking for inspiration in our curated watchlists.
If you're still not sure, try looking for inspiration in our curated watchlists.