SBI LIFE INSURANCE CO LTD Breakout Watch Above ConsolidationSBI Life has been consolidating in a sideways range between approximately ₹1,770 and ₹1,860 for over 40 days. The price recently tested the upper boundary of this range and closed near the resistance with strong bullish momentum and above-average volume, signaling potential accumulation and a likely
Next report date
—
Report period
—
EPS estimate
—
Revenue estimate
—
24.85 INR
24.13 B INR
1.16 T INR
447.21 M
About SBI LIFE INSURANCE CO LTD
Sector
Industry
CEO
Amit Jhingran
Website
Headquarters
Mumbai
Founded
2000
ISIN
INE123W01016
FIGI
BBG00GPZ57B6
SBI Life Insurance Co. Ltd. engages in the provision of life insurance. It operates through the following segments: Participating, Non-Participating, Linked, and Non-Participating Linked. The Participating segment offers participating insurance products that are designed to provide benefits over the entire life of the policyholders (whole life insurance), as well as products that provide benefits over defined periods (endowment life insurance). The Non-Participating segment comprises of individual savings, group savings, and protection segments. The Linked segment focuses on the benefit of investment as well as protection. The company was founded on October 11, 2000 and is headquartered in Mumbai, India.
Related stocks

SBI Life Long_Shows StrengthSBI Life Long:
- Price Shows strength.
- Consolidated for few days & today's candle Engulfed
prior week's entire price action
- Looks good for Long in short term.
- SL: Today's Low

SBI life heading for 2300-2400healthy retracement should lead the sbi life to 2300-2400 as per the cup & handle pattern

should go to 2300 after retesting the breakoutNow the stock is retesting the breakout area out of cup and handle, if this turns out to be true, the next target should be 2300.

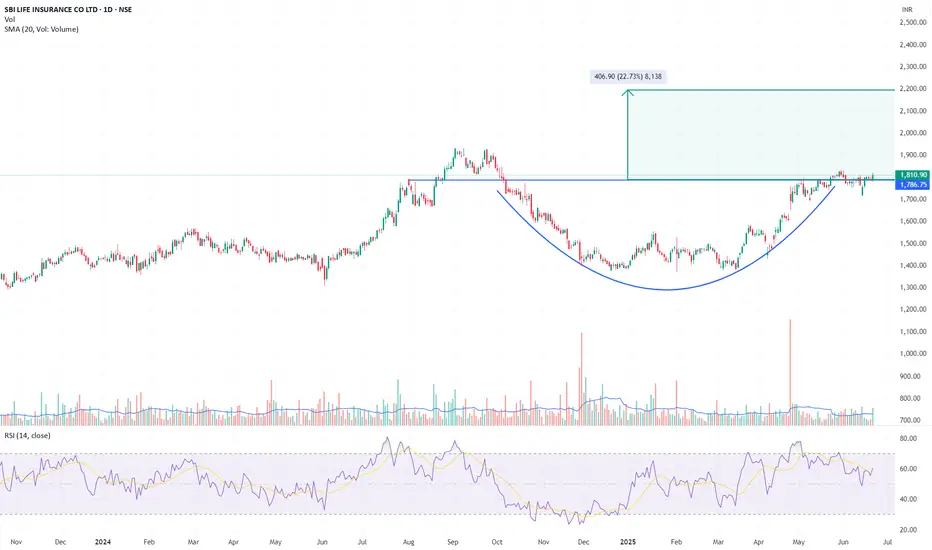
SBI Life – Long-Term Base Breakout, Targeting ₹2,200Chart Context:
SBI Life has broken out above a long-term horizontal resistance at ₹1,786 after forming a rounded accumulation base over ~10 months. Breakout was confirmed with above-average volume and a successful retest.
Trade Setup:
Breakout level (neckline): ₹1,786.75
Breakout candle cl
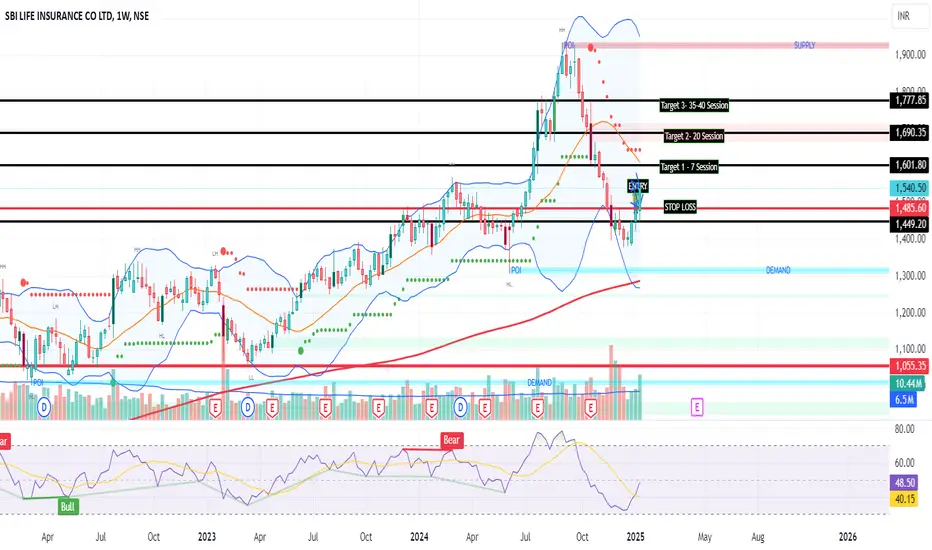
SBI Life Gaining MomentumKey levels for SBI Life Insurance Company's stock as of recent data are as follows:
Support Levels:
₹1,500: A psychological support level and a recent consolidation zone.
₹1,480: A critical technical support level based on recent price action.
₹1,450: Stronger support where buyers have historically
#SBI Life Insurance (Swing Trade) Demand ZoneSBI Life Insurance is currently trading near a strong demand zone, indicating a potential reversal or bounce opportunity for swing traders. This zone represents an area where buying interest has historically been strong, making it a key level to watch for entry.
SBILIFE Insurance Projection.I have analyzed based on the trend and different techniques of Gann. It is weak. It should go down as per chart. Target is apple.

[Swing Trade] SBILIFE - B.O1486Analysis:
Pattern Formation:
The chart shows a Cup and handle pattern in one hr TF. Price has moved about all the MAs in 1HR TF.
Breakout Zone:
The upper blue trendline (~₹1486) represents the resistance zone. A breakout above this level signals bullish momentum, and if there is a spike in vo

SBI Life Insurance - 320 monthly 49 Simple SG Patience fundaSBI Life Insurance - 320 monthly 49 Simple SG Patience funda
1) Inverted H n S
2) CMP at its lowest levels
3) Lets see

See all ideas
Summarizing what the indicators are suggesting.
Neutral
SellBuy
Strong sellStrong buy
Strong sellSellNeutralBuyStrong buy
Neutral
SellBuy
Strong sellStrong buy
Strong sellSellNeutralBuyStrong buy
Neutral
SellBuy
Strong sellStrong buy
Strong sellSellNeutralBuyStrong buy
An aggregate view of professional's ratings.
Neutral
SellBuy
Strong sellStrong buy
Strong sellSellNeutralBuyStrong buy
Neutral
SellBuy
Strong sellStrong buy
Strong sellSellNeutralBuyStrong buy
Neutral
SellBuy
Strong sellStrong buy
Strong sellSellNeutralBuyStrong buy
Displays a symbol's price movements over previous years to identify recurring trends.
Frequently Asked Questions
The current price of SBILIFE is 1,850.50 INR — it has increased by 0.93% in the past 24 hours. Watch SBI LIFE INSURANCE CO LTD stock price performance more closely on the chart.
Depending on the exchange, the stock ticker may vary. For instance, on NSE exchange SBI LIFE INSURANCE CO LTD stocks are traded under the ticker SBILIFE.
SBILIFE stock has risen by 3.04% compared to the previous week, the month change is a 0.06% rise, over the last year SBI LIFE INSURANCE CO LTD has showed a 9.74% increase.
We've gathered analysts' opinions on SBI LIFE INSURANCE CO LTD future price: according to them, SBILIFE price has a max estimate of 2,616.00 INR and a min estimate of 1,720.00 INR. Watch SBILIFE chart and read a more detailed SBI LIFE INSURANCE CO LTD stock forecast: see what analysts think of SBI LIFE INSURANCE CO LTD and suggest that you do with its stocks.
SBILIFE reached its all-time high on Sep 3, 2024 with the price of 1,936.00 INR, and its all-time low was 485.00 INR and was reached on Oct 1, 2018. View more price dynamics on SBILIFE chart.
See other stocks reaching their highest and lowest prices.
See other stocks reaching their highest and lowest prices.
SBILIFE stock is 2.14% volatile and has beta coefficient of 0.93. Track SBI LIFE INSURANCE CO LTD stock price on the chart and check out the list of the most volatile stocks — is SBI LIFE INSURANCE CO LTD there?
Today SBI LIFE INSURANCE CO LTD has the market capitalization of 1.84 T, it has decreased by −1.78% over the last week.
Yes, you can track SBI LIFE INSURANCE CO LTD financials in yearly and quarterly reports right on TradingView.
SBI LIFE INSURANCE CO LTD is going to release the next earnings report on Oct 22, 2025. Keep track of upcoming events with our Earnings Calendar.
SBILIFE earnings for the last quarter are 5.93 INR per share, whereas the estimation was 7.08 INR resulting in a −16.24% surprise. The estimated earnings for the next quarter are 7.22 INR per share. See more details about SBI LIFE INSURANCE CO LTD earnings.
SBI LIFE INSURANCE CO LTD revenue for the last quarter amounts to 171.80 B INR, despite the estimated figure of 176.57 B INR. In the next quarter, revenue is expected to reach 246.62 B INR.
SBILIFE net income for the last quarter is 5.94 B INR, while the quarter before that showed 8.14 B INR of net income which accounts for −26.94% change. Track more SBI LIFE INSURANCE CO LTD financial stats to get the full picture.
Like other stocks, SBILIFE shares are traded on stock exchanges, e.g. Nasdaq, Nyse, Euronext, and the easiest way to buy them is through an online stock broker. To do this, you need to open an account and follow a broker's procedures, then start trading. You can trade SBI LIFE INSURANCE CO LTD stock right from TradingView charts — choose your broker and connect to your account.
Investing in stocks requires a comprehensive research: you should carefully study all the available data, e.g. company's financials, related news, and its technical analysis. So SBI LIFE INSURANCE CO LTD technincal analysis shows the strong buy rating today, and its 1 week rating is buy. Since market conditions are prone to changes, it's worth looking a bit further into the future — according to the 1 month rating SBI LIFE INSURANCE CO LTD stock shows the buy signal. See more of SBI LIFE INSURANCE CO LTD technicals for a more comprehensive analysis.
If you're still not sure, try looking for inspiration in our curated watchlists.
If you're still not sure, try looking for inspiration in our curated watchlists.