SBIN (State Bank of India)Explore a compelling Elliott Impulse Wave formation on TrendingView, revealing a robust breakout support at 622. The presence of a symmetric triangle pattern suggests potential movement through the ascending channel (black line). With a short-term target range of 686 (0.5) to 698 (0.618) based on Fibonacci retracement, this analysis incorporates technical indicators like Daily Stoch RSI nearing zero .
Note: The provided information is for educational purposes only and should not be considered financial advice. Always consult with a qualified financial advisor before making investment decisions.
SBIN trade ideas


SBI BANK Monthly breakout LONGSBIN has given an monthly breakout after a year of consolidation.
It also formed an ascending pattern and gave its breakout at 620-630 levels.
CMP 642.05
Re-test level is 630-620

Good intraday setup in SBIFormed cup and handle in 15 mins and broken yesterday only. good for swing and intraday. It's only my view not a recommendation.

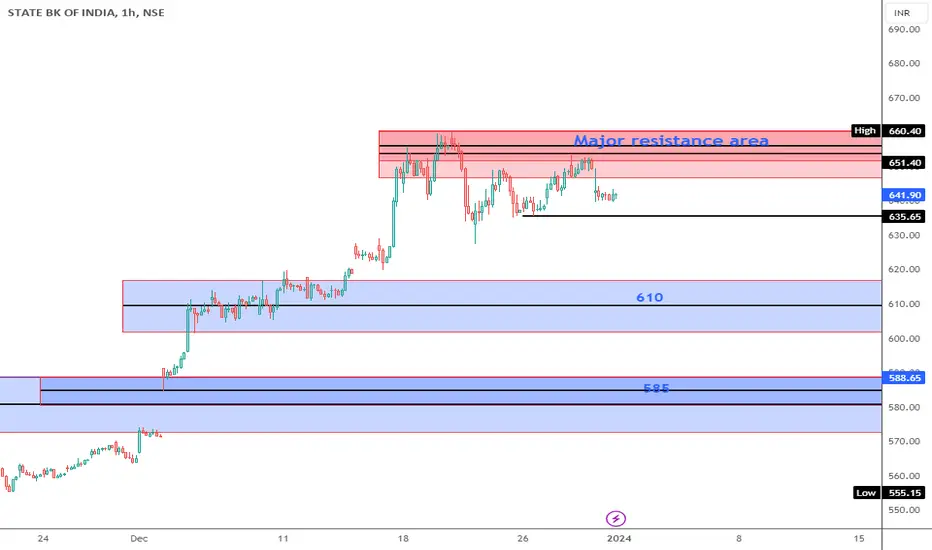
SBI Support & Resistance for 26/12/23Support and Resistance Levels:
Based on the price action, you have to identify two significant levels: the red line acting as resistance and the green line acting as support. Additionally, there have marked red and green shades to represent resistance and support zones, respectively.
Support: The green line and green shade represent support levels. These levels are where the price tends to find buying interest, preventing it from falling further. Traders can consider these levels as potential buying opportunities.
Resistance: The red line and red shade represent resistance levels. These levels are where the price tends to encounter selling pressure, preventing it from rising further. Traders can consider these levels as potential selling opportunities.
Breakouts: If the price breaks above the resistance zone (red shade) convincingly, it may indicate a bullish breakout, and the price could move higher to the next resistance level. On the other hand, if the price breaks below the support zone (green shade) convincingly, it may indicate a bearish breakout, and the price could move lower to the next support level.
Keltner Channel:
The Keltner Channel is a technical indicator that uses an exponential moving average (EMA) to create an upper and lower channel around the price action. Traders can use this channel to identify potential long and short positions.
Long Position: If the price is above the upper line of the Keltner Channel, it may indicate a potential long opportunity, as it suggests the price is trading above the average range and might continue in an upward trend.
Short Position: If the price is below the lower line of the Keltner Channel, it may indicate a potential short opportunity, as it suggests the price is trading below the average range and might continue in a downward trend.
Disclosure: I am not SEBI registered. I just wanted to let you know that the information provided here is for learning purposes only. Please consult your financial advisor before making any decisions. Tweets neither advice nor endorsement.


SbinStock name = State Bank Of India.
Weekly chart setup
Chart is self explanatory. Levels of breakout, possible up-moves (where stock may find resistances) and support (close below which, setup will be invalidated) are clearly defined.
Disclaimer: This is for demonstration and educational purpose only. this is not buying and selling recommendations. I am not SEBI registered. please consult your financial advisor before taking any trade.

State bank of India looks ready for another massive move upState Bank of India looks great at current levels.
Has been breaking out of ascending triangle on weekly.
We can wait for weekly close to happen to take an entry for good targets.

Technical Analysis on SBIN: Potential Uptrend Ahead 📈 **Technical Analysis on SBIN: Potential Uptrend Ahead** 🚀
SBIN appears to be completing its retracement structure in both smaller and larger time frames, signaling a potential upward movement. 🔄
We anticipate potential buying opportunities under the following conditions:
- **Break and Sustain Above 565:** A move above this level could trigger buying interest.
- **Completion of Minor Wave at 554-550:** Another entry point upon reaching this level.
This counter exhibits robust support at these levels on the larger time frame, adding to its bullish outlook. 📊
For strategic investment, we recommend a two-part approach:
1. **First Entry at 265:** If the price breaks without retracing to 554.
2. **Second Entry at 254:** Providing an additional entry point.
⚠️ **Risk Management:**
Set a Stop Loss at 250 on the hourly chart to mitigate potential downside risks.
This analysis aims to guide investors in navigating potential opportunities in SBIN, aligning with market dynamics and technical signals. 🌐💹
#SBIN #TechnicalAnalysis #StockMarket #InvestmentStrategy

SBI to INR 600 again?A 5-wave impulsive rise was spotted in SBIN beginning on 26Oct and ending on 16Nov.The stock moved 8% during this impulse.
The correction that began on 16 Nov was quite steep and swift forcing the stock to give up on 70% of the gains it made during 'wave i' phase.
Now, however after having completed the correction the stock is set to move up again in 'wave iii' phase. The projected length of this wave suggests that the stock could soon be at the INR 600 mark.
As of now the low of 555 is being considered as important reversal point and being considered for 'SL'.
Note*- The views expressed here are absolutely based on personal opinions &observations. Please do your own research before making any trading/investing decisions.

SBIN Buy opportunity for both Long term and short term SBIN Buy opportunity for both Long term and short term

Monthly Levels for SBINSBIN looks positive for rest of the Month..
We can plan for CE trade for this month Expiry or Next month Expiry
Buy Above 570 for the Targets of 576 & 585(Intraday)
Monthly Targets 595, 604, 633, 661
Please refer the levels for more Info
Please consult your financial advisor before investing
All research for educational purposes only.

#SBINDisclaimer - I am not a trained or registered analyst. I do this only for my learning.
I am not responsible for anyone's losses or profits.
SBI
- very well poised for an upmove. Good trend zone support with multiple previous interactions at this zone.
- Reasonable RR and small SL also.
BUT if it breaks and goes below than can be a Head and Shoulders pattern also.

SBIN long trade for short termhere in SBIN we can enter at current price keeping stoploss below 543 and aim for up to 690 in one month which is again 1:3 trade

SBIN@Support ZoneThis stock enters into the strong support area..
Look for buy opportunity in this stock.
Consolidation is observed and an inside candle plus fall is noticed..means of reversal chance...look for buy.

KING OF PSU BANK NOW READYIf you want to select any PSU BANK now then SBI look better because trading near Multiyear support ,

SBIN LEVELThis is for swing trade levels .....
take position based on this level with smaller TF reversal on your view ......
Octafx copy trade :BidaskeyTraders
Note:
This isn't financial advice, (not a buy or sell signal). This is for based on my knowledge and my risk management . Before following any ideas, do your own research and practice good risk management.

SBIN📢Head & shoulder Pattern 📢
CMP: 556.20
If stock price 553.15 day closing candle below than bearish movement see in coming days!
These are swing ideas which you can add your watchlist and analysis for yourself !
Keep on your radar 📡
This content only education purpose!
❗I am not sebi ragister❗


SBIN Stock in neckline
All DEMA Break
If neckline break stock down like a water fall.
Now wait & watch ⌚
MACD Bearish
RSI Bearish
Disclaimer this is my personal view for education purpose only
No Buy sell recommendations

SBINStocks trading near 5 day Low Its strong Support Zone , indicating a possible breakout
I am not SEBI register Advisor and I am not any trade and tips recommend here, This Idea post on this Channel Only for educational knowledge & learning purpose, I am not provide any trading tips, Before any Trade Advice your Financial Advisor, I am not responsible any profit and loss
