State Bank of India Sbin 15 minutes chart it is making triangle pattern chart in any side if it give break out we will take with a small risk
SBIN trade ideas

SBI breakout retestBreakout retest at 592.
I am expecting an upmove after retesting the breakout level.
Chart is only for educational purpose

SBINsbin looks good for 3 to 6 month swing trade ,profit booking going on so fall don't need to worry market will boom high

State Bank of IndiaHi guys, In this chart i Found a Supply Zone in SBI for Shorting, Observed these Levels based on price action and Demand & Supply. Don't Take any trades based on this Picture ...because this chart is for educational purpose only not for Buy or Sell Recommendation.. Thank Q

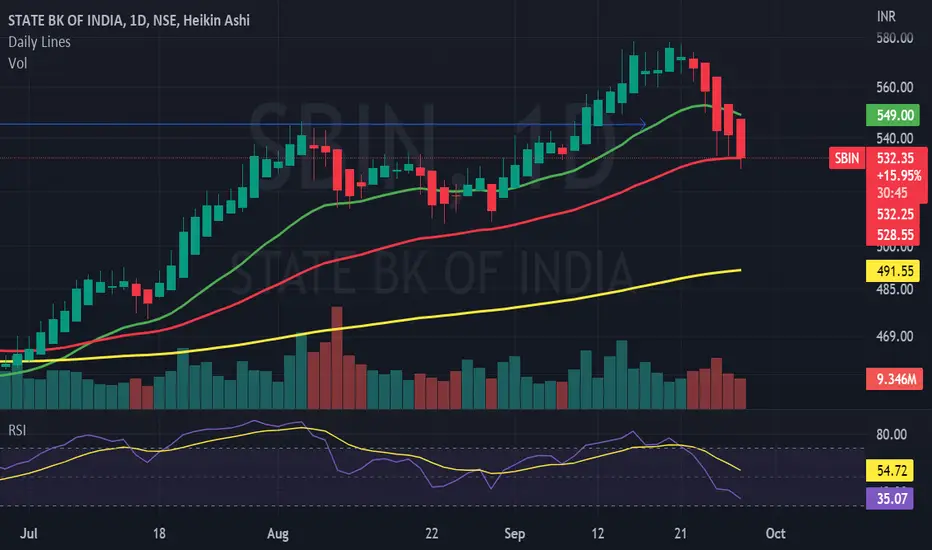
SBI short sellI feel it's too much away from the moving averages.
72% lifetime high fail.
There is a negative divergence too.
There is trendline resistance too in daily.
Doji on top is also a selling confirmation according to candlestick patterns.
it is overbought territory too.
The 3 bullish waves are also complete and it's ready for a pullback.

SBI Levels & Strategy for next few daysDear traders, I have identified chart levels based on my analysis, major support & resistance levels. Please note that I am not a SEBI registered member. Information shared by me here for educational purpose only. Please don’t trust me or anyone for trading/investment purpose as it may lead to financial losses. Focus on learning, how to fish, trust on your own trading skills and please do consult your financial advisor before trading.
SBI has posted excellent results and clearly beat the market expectations. I am feeling quite happy for long term investors who are consistently getting rewarded. SBI is trend is positive & momentum on buying side is strong. Buy on dips strategy is working well in SBI, however traders must be careful near new lifetime highs and work level by level with strict stoploss and maximize the profit using trailing stop loss.
Shall we wait & look for buy on dips opportunity in SBI in coming days?????
Yes, I think so.
Shall we book profits near major resistance levels/near new lifetime high?????
Yes, I think so.
Shall we short SBI near new lifetime high?????
We should avoid to short.
Is correction in coming days due to imported weakness in Indian market/RBI rate hike to curb inflation, likely to be buying opportunity for traders & long term investors????
Yes, I think so.
Please share your thoughts as well. Good luck to traders & investors for profitable trading in SBI.

Result with SBISBI results are out yesterday, the market has done better than what we thought, the company is doing this all-time high-paying business, but it can be made a good strategy for long term buy-on-dip only.
Fundamental good market leader in psu banks technically good 👍

SBINNSE:SBIN
> One can enter Now or wait for an Retest !
Note :
1.One Can Go long with a Strict SL below the Trendline or Swing Low of Daily Candle.
2. Close, should be good and Clean.
3. R:R ratio should be 1 :2 minimum
4. Plan as per your RISK appetite
Disclaimer : You are responsible for your Profits and loss, Shared for Educational purpose!

sbin at buy sidestock has given entry as per the strategy..and going very well...keep sl 508..target 536/546/566..almost 15%return expected.
FOLLOW US AND LEARN
TBB- Trade_bear_bulls
LEARN ONCE EARN FOREVER

SbinIt is trade near life time high.
Important indicator shows oversold.
Sell on rise in sbin.
Option chain analysis shows bearish.

Breakout in SBINState bank of India delivered very good results
It has beaten all the estimates
Buy according to levels mentioned in chart


SBIN - Bullish Price Action Analysis NSE:SBIN has already activated Harmonic PRZ 1.272 level in weekly timeframe of the target price 583.
BUY:
if price sustains above 520-522.
SELL:
if it not sustains above 520. you may get some profit booking up to 475.
Chances are more in favor of buyers to make new All time high so do accordingly.


SBIN I think share price goes down in few weeks because it breaks its top resistance then it turn back down . So now we have watch it.
If it make new support level or goes down previous support level .

Technical and fundamental analysis of STATE BANK OF INDIA (SBIN)Bearish view of State Bank of India (Sbin)
Future short with sl-550
Put option can be buy pe
State Bank of India is bearish on day, weekly and monthly setup

Sbi ,,,,,,,,,,_________________________Looking sbi 🐻 if break below 526________________________________$_$$$____


SBIN IntradayWhen sbin'll brake wedge pattern any where with retracement then we can make an intraday position

SBIN BTST making double bottomSbin took support at 533.20 and making double bottom in 15 min candlestick chart we can buy today and sell tomorrow
