SBIN Long Position. Intraday. Triangle patternWait for the market to start. If Nifty and BankNifty opens Gap Up, Take up the trade at around 10:00 am in the morning.
SBIN trade ideas


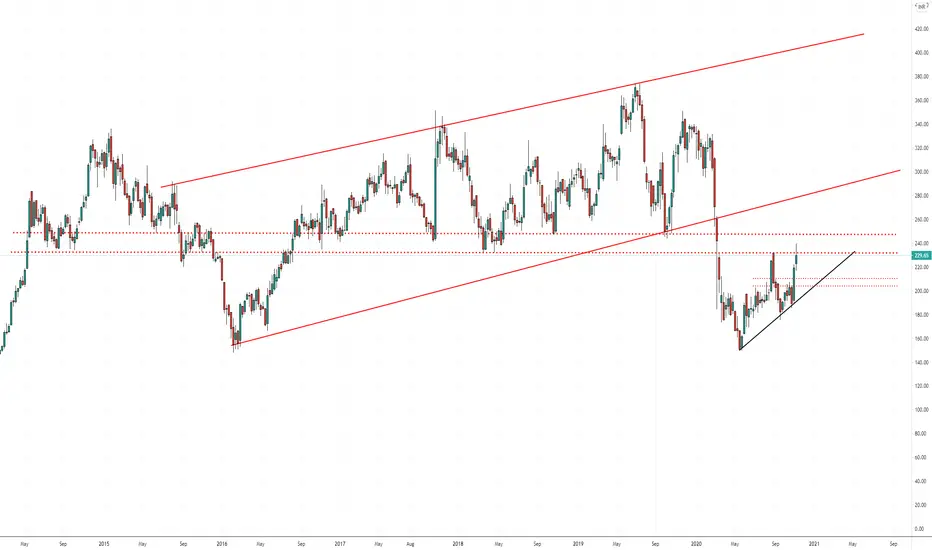
shortterm gain for SBINThe price is taking support of the inclined red color trend line. The price is been fluctuating within the parallel area. I believe the price might go to Rs. 263 before testing the water.
But the MACD is about to enter to -ve zone. So someone might have to wait for some time before entering into this.


SBIN Long SetupBuy : 200 , 205
Stop : 175 for short term , 160 for long swing
Target: 220 , 230 (short) , 250 , 270 ( long )


SBIN ANALYSIS CHART.........................SBIN 251.70 LVL. CORRECTION POSSIBLE....................


STATE BK OF INDIA 4HRBigger Butterfly & smaller Butterfly strong potential reversal zone
price need to follow Green Trend line & hit target
If price Breaks Red Trend line is where EXIT before SL hits
POTENTIAL SELL

SBINEasy to see head and shoulder pattern. Today in INTRADAY I took a stupid trade. As the candle closed below 222 on 5min chart I short Sell the share without noticing that the candle is taking support above support line and on 200day EMA on 15min time frame, and finally I closed with loss. Buy side was the good opportunity and I didn't saw it. SHARE MARKET IS ALL ABOUT CONTROLLING YOUR EMOTIONS. Please like if you have also done this mistake during your learning period.

SBIN - Bearish SBIN CMP - 226.80
Looking bearish in higher time frame. One can go for Intraday / Swing trade setup with the following entry, exit & targets
Sell at or Below ONLY 225 / Stop Loss 230.50
Target 1 - 222
Target 2 - 220
Target 3 – 217 / 215
Swing Trade Targets - 205
Disclaimer: This is my view and for educational purpose only.


SBIN levels to watchout for 13th November 2020It may retest and bounce back from the 222 support zone after the same resistance level is being broke on 10th but be cautious.


SBIN Weekly/Daily long 196,188-182 pro: 1.at swing low weekly SBIN Weekly/Daily long 196,188-182
pro:
1.at swing low weekly
2. entry to the zone is straight, so quick bounce
con:
1.very smaller daily candle in execution zones
2. 4 hrs candles are extremely small
confirmation entry only in daily candles

SBI has given reversal pattern after a fall in september.This stock has good potential to reach around 280+of price with present stock momentum. Kindly do proper analysis before investing.

SBI - Neutral to bullish view in coming daysPerfect example of an extended 5th wave (Blue)
when 1st (Black) and 3rd (Black) waves are of
equal length (26 points)
