SBIN 45MNBullish BAT + RSI DIVERGENCE
Ultra high volume down bars - trap of Smart Money , Higher volume-Professionals are buying into the public selling
ULTRA HIGH VOLUME for going LONG we need LOW VOLUMES in the area of ULTRA HIGH VOLUME BAR
Horizontal BLACK DOTTED lines r High & Low of ULTRA HIGH Volume CANDLEVertical dotted line is ULTRA HIGH VOLUME i.e SMART MONEY Price on breaking of ULTRA HIGH VOLUME Candle HIGH with NO SUPPLY i.e place for BUY
Potential Buy
SBIN trade ideas

SBIN 1HRBullish BAT + RSI DIVERGENCE
Ultra high volume down bars - trap of Smart Money , Higher volume-Professionals are buying into the public selling
ULTRA HIGH VOLUME for going LONG we need LOW VOLUMES in the area of ULTRA HIGH VOLUME BAR
Vertical dotted line is ULTRA HIGH VOLUME i.e SMART MONEY .Price on breaking of ULTRA HIGH VOLUME Candle HIGH with NO SUPPLY i.e place for BUY
Potential Buy

SBI SHORT- forming a descending triangle on 1hr timeframe
- if selling pressure continues in bank nifty than sbi can breakdown from 195 further to 192 and even 189, which is acting as next support

Short for next 5 days onlyIf we see chart sbin going for down more 05 to 10pts because its forms H&S Pattern.
Target 195 and SL 203 for next expiry...


18 ) LOOKING BULLISH @BUY AT - 204 , S L - 192Long term survival is a more important thing to consider in trading than short term profitability

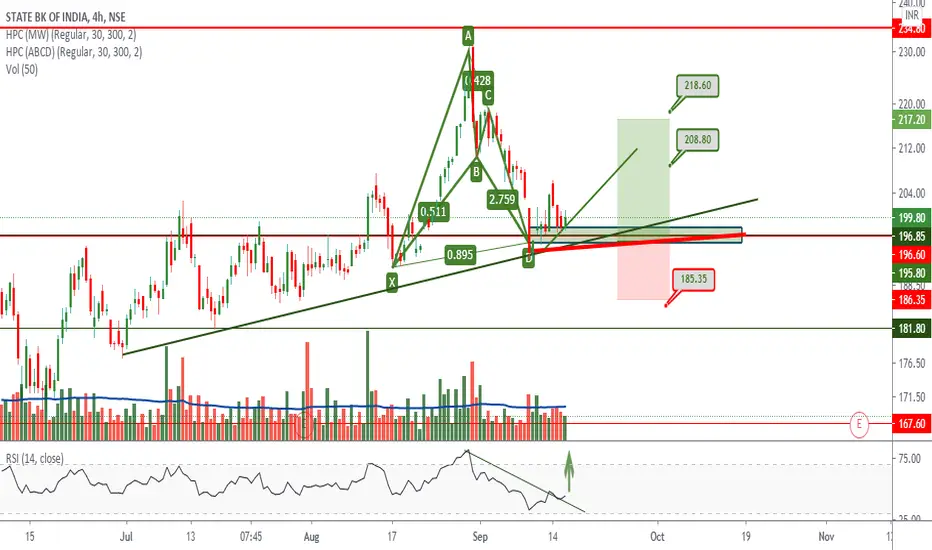
SBIN 4HRBULLISH BAT FORMED AT MAJOR Daily & 4HR SUPPORT & at TREND LINE SUPPORT So strong potential reversal zone
price need to follow Green Trend line & hit target
If price Breaks Red Trend line is where EXIT before SL hits
POTENTIAL BUY
BUY @ 195 above Target 211,228,243 for short Term SL 191As per Chart Analysis, Its seems uptrend as well as it will complete Mpatterm as i have drawn in pic...
If we see Technically,Last Result good and recently 10Kcr. Fund raised via bond selling.
Lot of Brokers giving Target 280 above.
Follow Strict SL 191. to exit when you see...

SBIN Looking good on charts for this Monday - 14-09-2020We see that SBIN crossed strong resistance at 201, As per the charts, this may reach 213 easily in a few trading sessions.

SBI levels for monday 14-09-2020State bank of India levels for 14-09-2020.
Don't short sbi if it's above 197. It's bullish above 197 so it can go 210, 220 easily.


SBIN 04 Sep 20Short opportunity in SBI...price faced resistance at Fibonacci Level....can be considered for shorting at CMP with 5 Rs STL.


SBIN : 03 SEP 20 :JUST LOOK AT FIGURE AND JUDGE WHAT MIGHT BE THE PATTERNS APPEAR?
SEE ALL MY PUBLICATIONS, IT TAKES AT LEAST 30 TO ANALISE FROM DIFFERENT ANGLES, IF THE ANALYSIS SEEMS TO GIVE BOTH KNOWLEDGE AND PROFIT, THEN ONLY LIKE SUBSCRIBE AND SHARE TO YOUR FRIENDS.
IF ABOVE 219 THEN W PATTERN SEEMS A GOOD BULLISH .
IF BELOW 212 THEN IT IS A HEAD AND SHOULDER PATTEN FOR BEARISH .

SBIN Heading to 220,230 in 15-20 daysSBIN has given ascending triangle breakout on 25-Aug (on daily chart) with high volumes & is in rising channel pattern now. RSI is at 67
Now it's Heading to 220,230 in 15-20 days SL 200 this is around 5-10% R.O.I

Wait and or Buy SBI @ 205-220 Target 235,251 SL 199 We can see this chart analysis, those target will achieve.
If u see technical analysis last quarter result good and momentum is good for up move...


Sbin - Still looking BullishRecovery possible . Bullish Hammer on the 15 Min chart towards the end of the trading day. Targets maintained for 1 Sep.
Disclaimer :
Professional Day/ Short-Term Swing Trader. Ideas and entities are opinions. Trade at YOUR OWN RISK. I am not your financial advisors. Risk it for the biscuit.
