SBIN-SHORTBearishtrend in formation on SBIN Price action suggests further upside potential. Key support and resistance levels to watch. Consider short position with appropriate risk management.
SBIN trade ideas

SBIN LONG 4 HR TRADEOn 240 mins, there are 2 levels, one below the other. Hence, either combine 2 levels or enter the distal line of 1 level and hold till SL or target.

SBIN-LONGTraders can consider long positions on a confirmation from order flow with appropriate risk management strategies.

SBIN- Analysis
757 above this bullish and 724 below this bearish
Bullish Levels -above 757 then 827 to 861 then 1034 to 1068 then then 1241 to 1275 then 1448 to 1482 then 1655 to 1689
Bearish levels :- Below 724 then 620 (SL level)
**Disclaimer -
I am not a SEBI registered analyst or advisor. I does not represent or endorse the accuracy or reliability of any information, conversation, or content. Stock trading is inherently risky and the users agree to assume complete and full responsibility for the outcomes of all trading decisions that they make, including but not limited to loss of capital. None of these communications should be construed as an offer to buy or sell securities, nor advice to do so. The users understands and acknowledges that there is a very high risk involved in trading securities. By using this information, the user agrees that use of this information is entirely at their own risk.
Thank you.

State Bank of IndiaTARGET MENTIONED IN CHART
SL - 545
PURELY TECHNICAL CALL
FUNDAMENTALS
Market Cap
₹ 5,52,612 Cr.
Current Price
₹ 619
High / Low
₹ 630 / 499
Stock P/E
8.14
Book Value
₹ 402
Dividend Yield
1.84 %
ROCE
5.20 %
ROE
16.8 %
Face Value
₹ 1.00
Promoter holding
57.5 %
EPS last year
₹ 62.4
EPS latest quarter
₹ 18.0
Debt
₹ 49,89,687 Cr.
Pledged percentage
0.00 %
Net CF
₹ -80,593 Cr.
Price to Cash Flow
-6.42
Free Cash Flow
₹ -90,057 Cr.
Debt to equity
13.9
OPM last year
41.8 %
OPM 5Year
35.3 %
Reserves
₹ 3,58,039 Cr.
Price to book value
1.53
Int Coverage
1.41
PEG Ratio
0.11
Price to Sales
1.39
Sales growth 3Years
9.14 %
Profit Var 3Yrs
50.0 %

SBI S/R for 8/7/24Support and Resistance Levels: In technical analysis, support and resistance levels are significant price levels where buying or selling interest tends to be strong. They are identified based on previous price levels where the price has shown a tendency to reverse or find support.
Support levels are represented by the green line and green shade, indicating areas where buying interest may emerge to prevent further price decline.
Resistance levels are represented by the red line and red shade, indicating areas where selling pressure may arise to prevent further price increases. Traders often consider these levels as potential buying or selling opportunities.
Breakouts: Breakouts occur when the price convincingly moves above a resistance level (red shade) or below a support level (green shade). A bullish breakout above resistance suggests the potential for further price increases, while a bearish breakout below support suggests the potential for further price declines. Traders pay attention to these breakout signals as they may indicate the start of a new trend or significant price movement.
20 EMA: The yellow line denotes 20 EMA, to interpret the 20 EMA, you need to compare it with the prevailing stock price. If the stock price is below the 20 EMA, it signals a possible downtrend. But if the stock price is above the 20 EMA, it signals a possible uptrend.
Disclosure: I am not SEBI registered. The information provided here is for learning purposes only and should not be interpreted as financial advice. It is important to consult with a qualified financial advisor before making any investment decisions. Tweets neither advice nor endorsement.

sbin - longSharing my bullish outlook for SBIN based on SBIN. Would love to hear your thoughts and insights on this setup.

SBIN LONGSBI =Monthly Demand 793 Weekly 781 Daily still in Formation if closed above 848 with bullish mode Target 1070
SBIN INTRADAY TO SWING Sbi can give a good INTRADAY to SWING trade with a decent stoploss and good Targets
ENTRY - 839.5
Stoploss - 833
TARGETS - 860, 875, 890++
Note- if any trade or value that's gone from the marked levels then that's not our trade just let it go or wait for it to come back
I'm not sebi registered this is my personal view

[Turtle] SBIN 880CESelling SBIN 880CE at 8.75
When it goes down, will sell the PE
Note -
One of the best forms of Price Action is to not try to predict at all. Instead of that, ACT on the price. So, this chart tells at "where" to act in "what direction. Unless it triggers, like, let's say the candle doesn't break the level which says "Buy if it breaks", You should not buy at all.
=======
I use shorthands for my trades.
"Positional" - means You can carry these positions and I do not see sharp volatility ahead. (I tally upcoming events and many small kinds of stuff to my own tiny capacity.)
"Intraday" -means You must close this position at any cost by the end of the day.
"Theta" , "Bounce" , "3BB" or "Entropy" - My own systems.
=======
I won't personally follow any rules. If I "think" (It is never gut feel. It is always some reason.) the trade is wrong, I may take reverse trade. I may carry forward an intraday position. What is meant here - You shouldn't follow me because I may miss updating. You should follow the system I share.
=======
Like -
Always follow a stop loss.
In the case of Intraday trades, it is mostly the "Day's High".
In the case of Positional trades, it is mostly the previous swings.
I do not use Stop Loss most of the time. But I manage my risk with options as I do most of the trades using derivatives

SBINKeep an eye on the STATE BANK OF INDIA as it approaches a minor resistance area. If the price holds above this level, it could present an opportunity for a profitable long trade.

SBI S/R Support and Resistance Levels: In technical analysis, support and resistance levels are significant price levels where buying or selling interest tends to be strong. They are identified based on previous price levels where the price has shown a tendency to reverse or find support.
Support levels are represented by the green line and green shade, indicating areas where buying interest may emerge to prevent further price decline.
Resistance levels are represented by the red line and red shade, indicating areas where selling pressure may arise to prevent further price increases. Traders often consider these levels as potential buying or selling opportunities.
Breakouts: Breakouts occur when the price convincingly moves above a resistance level (red shade) or below a support level (green shade). A bullish breakout above resistance suggests the potential for further price increases, while a bearish breakout below support suggests the potential for further price declines. Traders pay attention to these breakout signals as they may indicate the start of a new trend or significant price movement.
Disclosure: I am not SEBI registered. The information provided here is for learning purposes only and should not be interpreted as financial advice. It is important to consult with a qualified financial advisor before making any investment decisions. Tweets neither advice nor endorsement.

SBIN - Setting up for nice correctionSBIN chart is setting up for a nice corrective move post elections. This stock is still looking strong for a bigger move to the upside. Will be waiting patiently for the price to correct towards the given level of Demand

Intraday levels for today 04th June 2024 #SBIN Intraday levels for today 04th June 2024 #SBIN
Buying opportunity above 912
Support area around 900 area
Charts for Educational purposes only.
Not a Trading opportunity
Follow strict risk reward and stop loss if you follow the levels
Thanks,
V Trade Point

SBI S/R for 4/6/24Support and Resistance Levels: In technical analysis, support and resistance levels are significant price levels where buying or selling interest tends to be strong. They are identified based on previous price levels where the price has shown a tendency to reverse or find support.
Support levels are represented by the green line and green shade, indicating areas where buying interest may emerge to prevent further price decline.
Resistance levels are represented by the red line and red shade, indicating areas where selling pressure may arise to prevent further price increases. Traders often consider these levels as potential buying or selling opportunities.
Breakouts: Breakouts occur when the price convincingly moves above a resistance level (red shade) or below a support level (green shade). A bullish breakout above resistance suggests the potential for further price increases, while a bearish breakout below support suggests the potential for further price declines. Traders pay attention to these breakout signals as they may indicate the start of a new trend or significant price movement.
Disclosure: I am not SEBI registered. The information provided here is for learning purposes only and should not be interpreted as financial advice. It is important to consult with a qualified financial advisor before making any investment decisions. Tweets neither advice nor endorsement.

SBI to watch out forThe Convergence is visible. Watch the higher highs in the Price movement and higher lows in the RSI. The Resistance is there to be broken, a Long buy is evident. Breaching the support is a dream unless we have some scam waiting to happen.

SBIN 1DAYwait for the breakout and a retest.
.
.
.
.
.
.
.
I Am Not SEBI Registered Analyst. All Post and Levels Posting is only for educational and knowledge purpose. I Am not responsible for your any kind of loss or profit.
No Claim, All Rights Reserved.‼️

SBIN Trading in a range of 5%. Nothing much happened in this counter during the Banknifty fall.
If Banknifty moves up from here then it should give good returns.
Very clear horizontal boundary.
good support at 812. once broken we can see 790-800.
However, if we move up from here then there is a very high chance 836 will be broken and stocks will reach new highs.

Base on Base with #Breakout retest and cosolidationAs we can see on the chart #SBIN has given BO with WRC and volume expansion and after that it has retested and now consolidating in the range.
In this consolidation if you observe it only one negative candle which has no follow through and after that couple of long tail candle which show the buyers at BO level.
Further it is taking support of 20MA which shows me strength of stock.

SBISBI is currently trading in a sideways channel. A breakout is imminent, and we should consider planning for a long position once the breakout occurs.

Intraday view for SBIN 15th May 2024Intraday view for SBIN
Buying opportunity below 826
Charts for Educational purposes only. Not a trading recommendation.
Follow strict risk reward and stop loss.
Thanks,
V Trade Point

SBIN UP MOVE Sbin an give a good up move with a decent stoploss and good Targets for swing and positional trade opportunities
ENTRY - 813
STOPLOSS -807
TARGETS - 830, 835++
Note- if any trade or value that's gone from the marked levels then that's not our trade just let it go or wait for it to come back
I'm not sebi registered this is my personal view

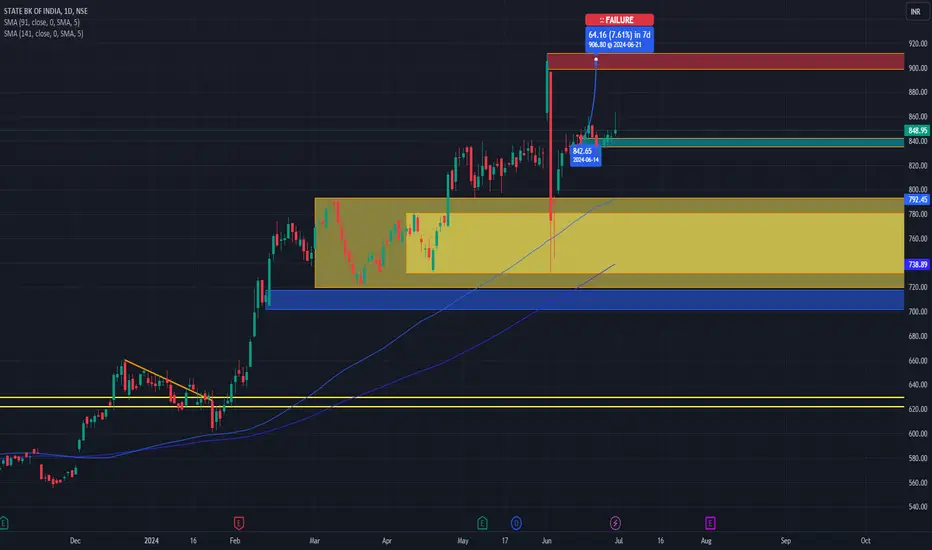
SBIN MAY LOOK FOR A CORRECTION AHEADSBIN has been on a robust bullish streak, indicating a possible retracement or correction phase in the near future following its recent rally. There's potential for the price to consolidate within a formed channel before potentially breaking out bearishly, supporting a bearish outlook.
