Sequent - My pick - No AdviceStrong Rally followed by period of consolidation with squeeze in volumes showing lack of selling pressure. Stock is resting at support level. if price drops below 180, could trigger stronger selling. A long-term investor may wait for a better entry near intrinsic value 155–160. Conversely and upside break could tigger a fresh rally. Business fundamentals show growth in revenue & profit, but high valuation leaves little room for error.
SEQUENT trade ideas
Good buying opportunity in Sequent ScientificBullish engulfing candle and taken support from a trendline. Sequent Scientific can go upto 181,192, 199 levels.

SEQUENT:NSE RBC&H 2Y-8M onDTF/WTF/MTF PositionalSEQUENT Analysis WTF
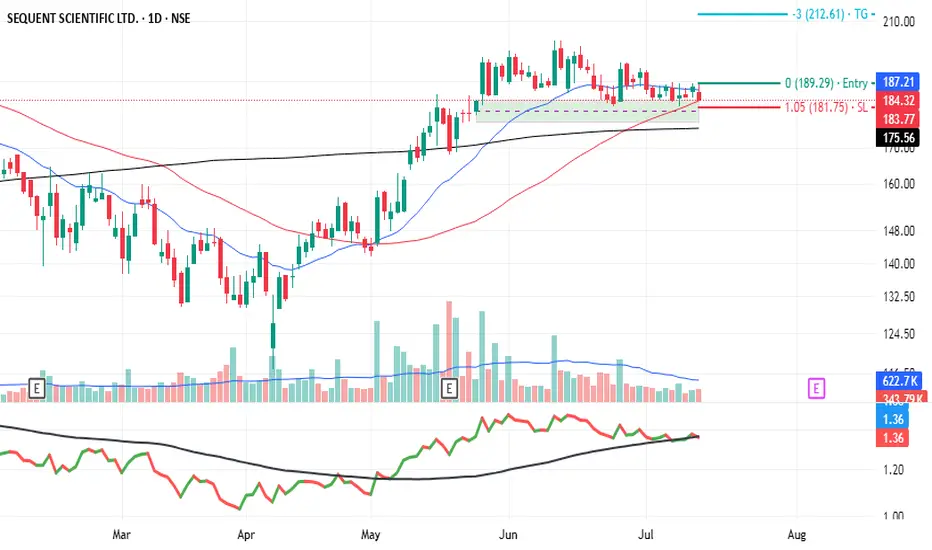
TRADE PLAN
ENTRY -200-205 25%Qty, 25% Qty @ 190 Add further above 225
SL -187
TARGET --01-243 @27% gain, TGT02--335 @75% gain from 202
Hold For a Year or TGT 2
Keep in your Priority Watch List
Chart Pattern :
STOCK has recently broken its 52W HIGH of 202 forming a 2Y-8M RBC on the DTF/WTF/MTF. Currently on a Pullback to form a Handle ON DTF. The FVG on WTF, can get an Entry price of 190
INDICATORS EMA :
The Price is Currently Trading above 20EMA, and 20EM crossed above 50EMA in DTF/WTF early July. 50EMA came close to 200EMA in June in WTF then turned upwards confirming the Bullish Continuation. STOCK EMAs are currently aligned in a ascending order 200 to 20 and moving apart indicating a bullish Trend continuation on DTF/WTF/MTF.
FIBO E :
After the Bounce-back from 61%FIBO Retracement Level, Price is currently trading near the 127% FIBO Extension level of 211 on WTF Impulse uptrend with ChoCH at 174 on DTF
Volumes: There is a uptrend in Volume on the Weekly Charts for1 Weeks and currently in Pullback.
Disclaimer: For Education/Reference Purpose Only, Trade at your Own Risk with correct position sizing and SL based on your Risk-apetite. Trail Your SL progressively. Learn/Know and Review the Stock trading Technical Terminology. Check Verify the Financial fundamentals of the Stock and Seek Advice from a Certified Financial Advisor prior to Investing. Prefer Entry with 25% quantity, Add in Tranches of 25%-50% as prices moves upwards recommended.
MTFA- Multiple Time Frame Analysis
DTF -Daily Time Frame
WTF-Weekly Time Frame
MTF- Monthly Time Frame
ATH-All Time High
RBC&H-Rounding Bottom Cup/Handle
BO- Breakout Close
EMA -Exponential Moving Average
FIBO R/E -Trend based Fibonacci Retracement/Extension
SL Stop Loss
TBD- To be Decided
CHoCH- Change of Character Bullish/Bearish
MSB/BOS -Break Out Structure
FVG Fair Value Gap
SWING/POSITIONAL Trade

#SequentscientificIn short term stock has made a reverse head and shoulder, then breakout with volumes and now breakout retest, Now near support level, yesterday made a dragonfly doji, which indicates a reversal on chart. Company has posted turnaround results on YoY and QoQ Basis. Stock Looking for a good upside. Buy at current price, Stop loss 132, Target, 149/155 for 7-15 days. If crossed 155 then in next 1-3 Months can touch 190 also.

0.5 Fib levelGood volume build in daily and weekly timeframe.
Highest volume ever buildup in this IPO.
Price has crossed its 0.5 fib level with good volume.
Smallcap⚠️⚠️.
Fundamentals are Ok and improving.
NOTE: I do my analysis, do yours before trade.
Eat🍜 Sleep😴 TradingView📈 Repeat 🔁

SEQUENT SCIENTIFIC - Multi Year Breakout StockINVERSE HEAD & SHOULDER PATTERN BREAKOUT STOCK FOR SWING TRADING
> 2 Years of Inverse head & shoulder breakout
BUY PRICE : 155
SL : 125 (only for swing traders)
TARGET : 202, 250, 305 (100%)
Disclaimer - All information on this page is for educational purposes only,
we are not SEBI Registered, Please consult a SEBI registered financial advisor for your financial matters before investing And taking any decision. We are not responsible for any profit/loss you made.

Inverted Head & Shoulder BreakoutThe stock has broken a 2.5 year Inverted Head and shoulder with 4x volumes. Buy at retracement range between 155-160 for a target of 375.

Sequent Scientific positionalAbove 40 EMA
Gap up on daily BO
weekly BO on large volume
Consolidation of more than 2 yrs
No over head supply on left side
Bumper results/EPS growing
Increasing RS

SEQUENT READY TO RALLY UPSIDE.SEQUENT has given a breakout with a big bar green candle, also have volume spikes. This gives a signal to buy SEQUENT.

SEQUENT- Analysis
Entry above 141 or 150
Expected Major targets - 172 or 178 if sustain above this then 206 then 221 then hold.
Minor Targets - 159 and 199
Stop loss - closing below 135 and strictly 120
Please do your due diligence before trading or investment.
*Comment or message me if you wish to see my analysis for any stocks.
**Disclaimer -
I am not a SEBI registered analyst or advisor. I does not represent or endorse the accuracy or reliability of any information, conversation, or content. Stock trading is inherently risky and the users agree to assume complete and full responsibility for the outcomes of all trading decisions that they make, including but not limited to loss of capital. None of these communications should be construed as an offer to buy or sell securities, nor advice to do so. The users understands and acknowledges that there is a very high risk involved in trading securities. By using this information, the user agrees that use of this information is entirely at their own risk.
Thank you.

SEQUENT SCIENTIFICABove 160 closing on day chart, can trigger some great upcomes.
as 160 was the ipo base breakout as well and it was a critical support as well.
Buy this above 160 for a sharp rally for 100% upside.
Fundamentals are improving slowly and same is observed In the chart pattern as well.
India's one of the largest Animal health care product company.
Disclaimer: only for education purposes, no buy or sell recommendation. we are not sebi registered. always discuss first with your financial advisors

SEQUENT Theses are swing ideas which you can add your watchlist and analysis for yourself !
Keep on your radar!
I am not sebi ragister

Bearish STOCKA complete bearish cup formation on this pharma stock. The stock now stands on a very crucial point, the support level around (160-185). It may take a turn after the huge fall and consolidate around these levels for sometime. RSI is also below 40.

Sequent Scientific - Buy Opportunity & HoldAs per previouse chart history and technical analysis of this stock, it indicates to buy at 140.60 and hold for long run and wait for retest of previouse level between 126-110 and after reversal from this point, you can buy for a good profit.
Do your own research before entering into the market.
I am not SEBI registered person and this is just my own opinion about this stock.
Thanks for your support as always

SEQUENT !! GOOD TREND CHANGE1) CONSOLIDATION
2) BREAKOUT WITH VOLUME
3) CONSOLIDAITON
Best way stock is going up with all time high volumes

sequentDown trend ended by price action lower low formation ended. Break out with gud volume. 200 MA will be hurdle. Target will be huge.
Buy on some retracement
sl 90
it has gud potential for upside . Follow strict SL & Proper RISK REWARD RATIO. This is the only holy grail in the market.

ROUNDING BOTTOM PATTERN UNDER PROGRESS ON SEQUENT SCIENTIFICERounding bottom under progress on SEQUENT SCIENTIFICE monthly chart. Brake out level @ 128. if price sustain above 128, position can be initiated for target price of 230. stop loss is (-10 point)

Buy sequent at 90-95Sequent 3 months very tight closing around 90-95.
Time to buy some quantity for moderate risk takers.
Target 600 till end of 2026 or before

Sequent Bull Move Continuous Sequent is performance based stock. It gave a breakout earlier and now after a nice consolidation it seems to move again in bullish direction.
Reasons :
Taking support at 200 EMA and VWAP.
moving in Higher HIGH Higher LOW.
Important level are marked in the chart.
RSI breaking 50 to upside shows Bullishness.
Re-Breakout after 3 month of consolidaiton.
Verdict :
Bullish breakoutContinuous
Plan of action:
Buy: 92.65
Stoploss: 86
Target: 107

Sequent Scientific Breakout Short termMonthly is reversing from major support zone, previous low. Bottom fishing.
Weekly is into an uptrend, RSI is perfectly moving from over sold to strength zone of 70+
Daily broke out of consolidation zone, flag anf pole pattern.
One can look for trade as per the supply zones marked.

SEQUENT - Bullish Consolidation with VolumesNSE: SEQUENT is closing with a bullish consolidation candle supported with volumes.
Today's volumes and candlestick formation indicates strong demand and stock should move to previous swing highs in the coming days.
The stock has been moving along the horizontal support for the past few days which is indicating demand.
One can look for a 8% to 13% gain on deployed capital in this swing trade.
The view is to be discarded in the event of the stock breaking previous swing low.
#NSEindia #Trading #StockMarketindia #Tradingview #SwingTrade

Downtrendline BreakoutThe stock has broken a two year downtrendline with good volumes. Buy at 90.60, accumulate till 72 for a long term target of 311.

After a long time, the peaks of Sequent are looking possibleSequent has been a poor performer for long in the last few years
Looking at the pattern now, it looks as thioughl, the prblems, of the troughts are over and a conquest of the peaks is on the way.
