This Water Related Stock is A Good Buy....#shaktipump looks good around 1030 to go long and let it make a new high.
Water Management Stock.
SHAKTIPUMP trade ideas

Positional Setup for Shakti Pumps (India) Ltd (NSE)CMP: ₹978.50
Breakout Zone: ₹1,030–1,070
Support Zone: ₹850–860
Price Action: Price is consolidating just below resistance, creating a base near the breakout zone.
📈 Technical View (Positional)
Price has shown strong recovery from the support zone (~₹850), moving towards a crucial resistance area at ₹1,030–1,070.
This zone has acted as a major supply zone in the past — a clean breakout above ₹1,070 could trigger fast upside.
Short-term pullback offers a good accumulation range before breakout attempt.
🚀 Positional Levels:
Entry Range: ₹960–985
Target 1: ₹1,070
Target 2: ₹1,180
Target 3: ₹1,320
Stop-Loss (Closing Basis): ₹935

shakti PumpShakti Pump
MTF MTF-Zone TREND MTF Analysis Logic Proximal
HTF Yearly UP Shakti PumpYearly Demand RR 640
HTF Half-Yearly UP Shakti Pump6 Month Demand BUFL 846
HTF Qtrly UP Shakti PumpQtrly Demand BUFL BUFL 846
HTF Average UP 777
MTF Monthly UP Shakti PumpMonthly Demand BUFL 900
MTF Weekly UP Shakti PumpWeekly Demand DMIP 712
MTF Daily UP Shakti PumpDaily Demand DMIP BUFL 825
MTF Average UP 812
ITF 240M UP Shakti Pump240Mn Demand BUFL 812
ITF 180M UP Shakti Pump180 Mn Demand BUFL 812
ITF 60M UP Shakti Pump60 Mn Demand BUFL 778
ITF Average UP 801
Trade Points 797
Trade Plan BUY Shakti Pump ENTRY-1
Entry-1 825
Entry-2 778
SL 750
RISK 75
REWARD 1274
Target as per Entry 2099
RR 17.0
Last High 1387
Last Low 750

ShaktiPump looks good for invetsmentShaktiPump 876 is at trend support and is trading at 27 P/E of Fy26 EPS. Sector P/E is at 42 which has a target of 1350. Stock Price CAGR of 5 Years is greater than 100 % Additionally FII's have increased their stake. Considering all facts we expect ShaktiPumps will be a valuble asset in portfolio


Momentum Idea - Shakthi Pump Momentum Idea - Shakthi Pump cmp 989
Buy with the extended Target of 1089, 1148
Medium Term Target - 1303
Support 884 - 913
33% Upside Potential

Shakti pumpsShakti pumps has bounced from good zone, moving with strength. Marked inmediate resistandes with blue line.

shakti pumps in channel at supporttrading in channel, at support watching in channel.
education purpose only.

SHAKTIPUMP - Bullish SetupStock name - Shakti Pumps India Limited.
✅#SHAKTIPUMP trading above Resistance of 3382.
✅Next Resistance is at 3882.
✅Moved 145% in 22 weeks.
Weekly chart setup
Chart is self explanatory. Levels of breakout, possible up-moves (where stock may find resistances) and support (close below which, setup will be invalidated) are clearly defined.
Master Score - B
Disclaimer: This is for demonstration and educational purpose only. this is not buying and selling recommendations. I am not SEBI registered. please consult your financial advisor before taking any trade.

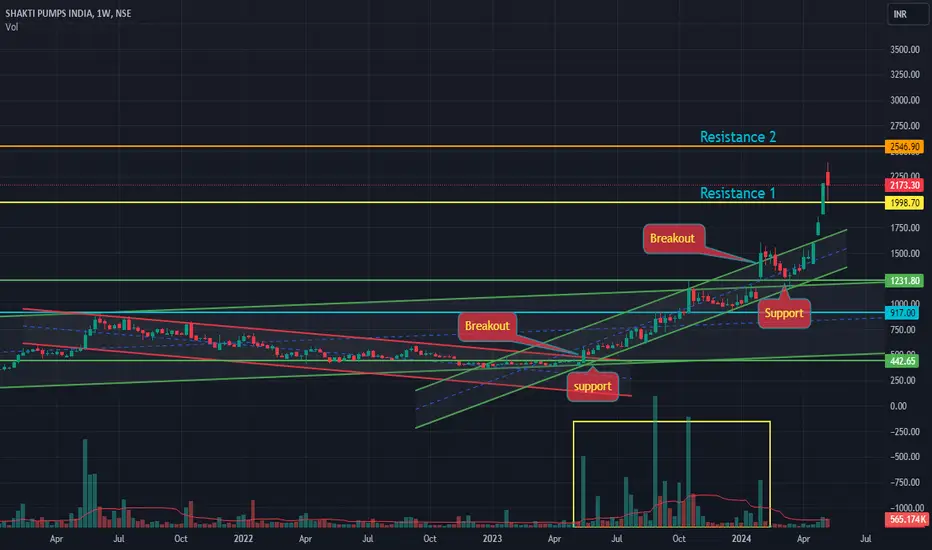
SHAKTIPUMPS - Bullish setup onStock name - Shaktipumps Limited.
✅#SHAKTIPUMPS trading above Resistance of 2000.
✅Next Resistance is at 2546.
✅Moved 45% in 13 weeks.
Weekly chart setup
Chart is self explanatory. Levels of breakout, possible up-moves (where stock may find resistances) and support (close below which, setup will be invalidated) are clearly defined.
Master Score - A
Disclaimer: This is for demonstration and educational purpose only. this is not buying and selling recommendations. I am not SEBI registered. please consult your financial advisor before taking any trade.
Shakti Pumps - Ready to Pump Higher :)Shakti Pumps - Comparison of Quarterly Chart vs Weekly
Today price was locked in 5% UC
Quarterly View: Long Term
On Quarterly, the price is following a 12 Year Parallel Channel
Cup and Handle BO done on Monthly for Target of 2105
Weekly View: Short Term
On Weekly - Price is seeing to be travelling in a smaller Parallel Channel
Inside the parallel Channel, repeated Cup Patterns (Rounding Bottom) seen
Latest Rounding Bottom BO confirmed on weekly above 1605 for Short Term Target of 2055
Disclaimer:
3+ Years Teaching Experience in Stock Market - Technical Analysis, Advanced Patterns, Emotional Management, News based Trading...
We are NOT SEBI Registered and Our focus is NOT providing Buy/Sell Recommendations/calls. Primary Objective is to provide detailed analysis of how to review a chart, explain multi-timeframe views purely for Educational Purposes.
We strongly suggest our followers to "Learn to Ride the Tide irrespective of its Side"
*** Important *** Consult your Financial Advisors before taking any positions
If you like our detailed analysis, please do rate us with your Likes, Boost and share your comments
-Team Stocks-n-Trends

SHAKTIPUMPStock name = Shakti Pump INDIA Limited.
Weekly chart setup
Chart is self explanatory. Levels of breakout, possible up-moves (where stock may find resistances) and support (close below which, setup will be invalidated) are clearly defined.
Master Score - B
Disclaimer: This is for demonstration and educational purpose only. this is not buying and selling recommendations. I am not SEBI registered. please consult your financial advisor before taking any trade.

SHAKTI PUMPS INDIA SHAKTI PUMPS INDIA (1D)
CMP 717.60
Price has given breakout and consolidating in a range
Retested breakout zone
Shakeout also happend so weak hands are out and strong hands can take it higher

$SHAKTIPUMP 2R Trade IdeaNSE:SHAKTIPUMP i feel a small dip to the OB marked could give a 2R trade opportunity in Daily.
What is your view?

Triangle Pattern BreakoutPlease look into the chart for a detailed understanding.
Consider these for short-term & swing trades with 2% profit.
For BTST trades consider booking
target for 1% - 2%
For long-term trades look out for resistance drawn above closing.
Please consider these ideas for educational purpose

Shakti PumpsShakti pumps appears to repeat the pattern yet again which is being seen from its inception
Also, it BOnthe flag pattern and supporting at one of the major gann levels
MACD cross over being done and looks bullish
Levels are marked in the chart for SL and targets


Resistance BreakoutPlease look into the chart for a detailed understanding.
Consider these for short-term & swing trades with 2% profit.
For BTST trades consider booking
target for 1% - 2%
Please consider these ideas for educational purpose
Comment below if you are looking for any answers.

Shakti PumpsLooks good in the medium term and about to break the resistance levels at 560 levels
Weekly closure above this level is a safe entry

SHAKTIPUMPChart looks good. A Possible up move, can keep a watch. Stock has given a breakout, wait for retest and confirmation. Please also do your Study and Analysis before considering buying. Idea is for cash market only.

Shakti Pump : Positional Trade.Seeking Professionals guidelines to trade this counter on staggered way approach. 34% @ high of 21 August candle or Trend Line Breakout, 33% @ 564 and 33% above 581. Stop loss will be 409 and target will be 1210.
Note : Its Not a buy call, Please do your own research/ consult your financial advisor before all..

Potential Cup & Handle formationChart shows that the price is taking support at the levels drawn and also looks like its forming the Cup& Handle pattern on the chart.
This is purely a technical view and not a buy or sell recommendation.

Shakti Pumps can gain strength above 590 closing.Shakti Pumps CMP 555.85 looks good for Fresh entry above 590 closing. Keep in Radar. Targets will be 631, 650 and 715. Keep a trailing stop loss at 530.
Note: Wait for closing above 590.
