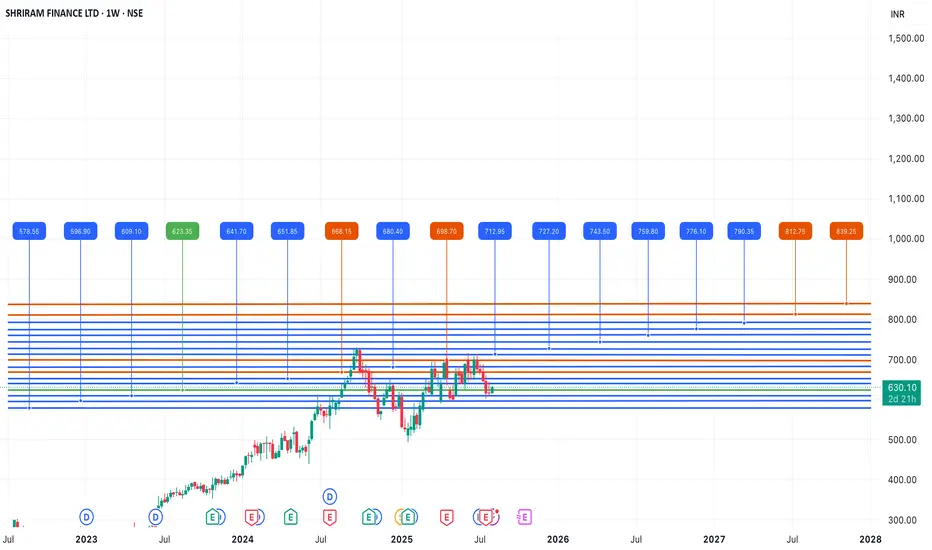
Shriram Finance on Radar ! Bullish Setup !This is the daily chart of SHRIRAMFIN.
SHRIRAMFIN having a good law of polarity near at 580-600.
if this level is sustain then we may see higher prices in SHRIRAMFIN.
Thank You !!
SHRIRAMFIN trade ideas

SHRIRAM FINANCE MID-TERM VIEWShriram Finance is looking positive for the next 4-6 months. We can expect a short-term low of around 570, and from there on, the charts are indicating a chance for a potential upside momentum up to 800-830, with it facing resistance in the range of 670-700.
THIS IS MY PERSONAL VIEW , NOT A BUY/SELL RECOMMENDATION.
SHRIRAM FINANCE LIMITED in a channelThe stock experienced a strong bullish move (5-wave uptrend), currently consolidating inside an upward channel.
Price is facing resistance near ₹700–₹735.
The momentum indicator (RSI) suggests no extreme buying or selling; trend is neutral to cautiously bullish unless a clear breakout or breakdown occurs.
Support: Lower channel boundary (~₹660).
Resistance: ₹700–₹735.
Strong move above resistance could signal further upside; a break below the channel may indicate a corrective decline.

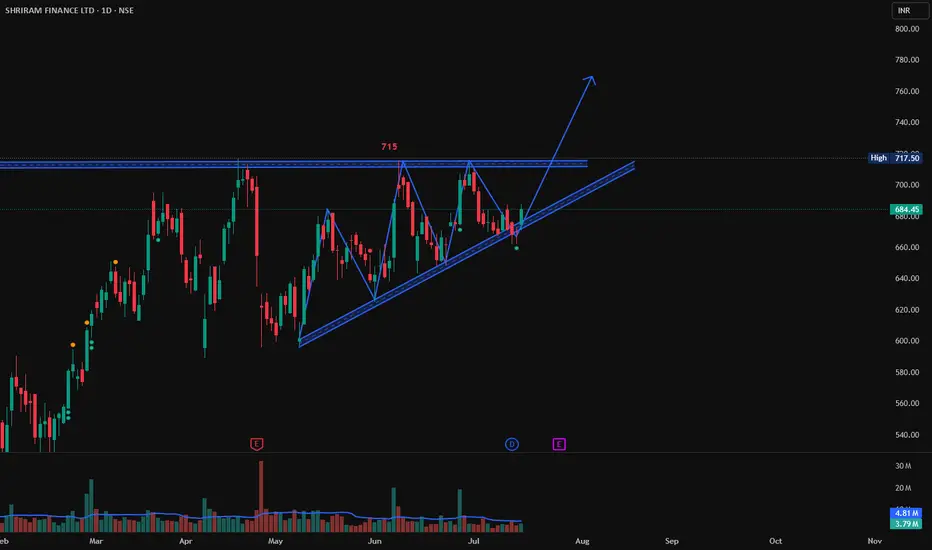
Shriram Finance following TrendLine, Long TradeShriram Finance is following the TrendLine. If it cross the high created today at 688 and shows a good Bullish candlestick patterns like Bullish Engulfing, Hammer & Inverted Hammer, Piercing Line, Morning Star, Three White Soldiers, Tweezer Bottoms or Bullish Harami. Then it may go till 715 which is strong resistance level.
Entry above 688 on Bullish Candlestick pattern.
Target: 715
Stop Loss: 680
Shriram financeShowing bullish signal.
But there is resistance after 8 to 9%
So define your SL before leap into it.
SHRIRAMFIN | Risk-Takers Buy @LTP, Safer Entry Above 723, SL 640Disclaimer:
This is not financial advice. Please do your own research or consult with a financial advisor before making any investment decisions. Investments in stocks can be risky and may result in loss of capital.

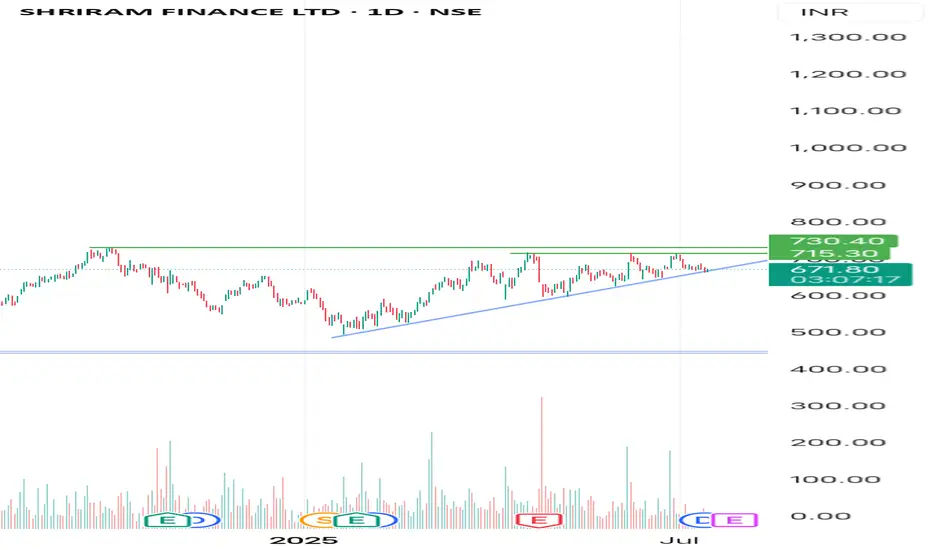
SHRIRAMFIN ANALYSIS The chart is a daily candlestick chart of Shriram Finance (SHRIRAMFIN) traded on the NSE, with the date shown as May 30, 2025.
Here’s a summary of the analysis presented in the chart:
---
Technical Highlights:
Current Price: ₹639.50
Trend: The price is currently in a downward correction phase.
Support Level: Marked clearly at ₹589.25 — this is the target level indicated by the analyst.
Expectation: The chart suggests a bullish reversal (bounce) from the ₹589.25 level, as illustrated by the curved arrow.
Moving Average: A short-term moving average (possibly 10 or 20-day) is shown, with the price hovering just below it — indicating potential short-term weakness.
High/Low Reference:
Recent High: ₹717.50
Recent Low: ₹508.60

Shriramfinance 691- breakout - trend directionShriramfinance 691- Has given breakout after successfully completing pull back test. As signals are positive with hidden divergence we expect shriramfin will test 791 in coming days with support 640 .
** HSBC identifies five Indian stocks
RELIANCE
ICICIBANK
TVSMOTOR
Shriram Finance
ADANIPORTS
— as its top picks offering profit visibility
** Shriram Finance stands out for its superior asset quality; Adani Ports is a proxy for India's trade and infra growth, says HSBC

SHRIRAMFINSHRIRAMFIN
watch above levels. green line is our entry, redline is our SL.
DISCLAIMER : I am NOT a SEBI registered advisor or a financial adviser. All the views are for educational purpose only.

SHRIRAMFIN CMP 580.SHRIRAMFIN With Strong Fundamentals.
Price to Earning--15,Price to Book Value--2,Dividend Yield--2%.
Strong Performer from YOY and QOQ.With heavy Institutional Holdings.
In this correction This stock trading at best and Affordable Price for Investors and Long term Players.We can add this to Our Portfolio.For the targets-600........630......680........700.With the stolposs Around 530.

SHRIRAM FINANCESince the low in January 2024, the stock has been rising impulsively and is currently trading within wave 3. This indicates that any pullback should remain above the 590 zone, with prices expected to continue trending toward 730 in the coming weeks to complete the wave-4 and wave-5.

#SHRIRAM FINANCE SUPPLY ZONE If you're analyzing Shriram Finance (SHRIRAMFIN) for a potential supply zone, here's a detailed guide on how to identify and analyze supply zones using technical analysis. A supply zone is an area on the chart where selling pressure is dominant, causing the price to reverse downward.

Shriram Finance (₹617.30) – Trendline Breakout Confirmed!Shriram Finance (₹617.30) – Trendline Breakout Confirmed!
It just cleared a key descending trendline, suggesting a potential bullish reversal. Watch for:
Immediate Support: ~₹600
Next Resistance: ~₹650
Trend: Turning bullish post-breakout
Are you going long here, or waiting for a pullback? Share your thoughts!
#ShriramFinance #Breakout #TechnicalAnalysis #StockMarket

SHRIRAMFIN | Buy above @ 621 | SL below @600 | Target @700Disclaimer:
This is not financial advice. Please do your own research or consult with a financial advisor before making any investment decisions. Investments in stocks can be risky and may result in loss of capital.

#SHRIRAMFINANCE [27-02-2025]In trading and technical analysis, a supply zone is an area on a price chart where selling pressure is significantly strong, causing the price to reverse or drop. For Shriram Finance (a leading NBFC in India), identifying supply zones can help traders make informed decisions about exit points.

#ShriramFinance Supply ZoneShriram Finance is a prominent non-banking financial company (NBFC) in India, offering a wide range of financial services, including vehicle loans, personal loans, and business loans. When discussing the "supply zone" in the context of Shriram Finance, it typically refers to a technical analysis concept used in trading and investing.

BUY SHRIRAMFIN ABOVE 584Shriramfin giving good daily breakout people can take entry above 584, NBFC stocks are showing good potential from last week keep stoploss below 525 and can ride stock until 700rs.

SHRIRAMFINNSE:SHRIRAMFIN
Buy at cmp
reverse from support
once close 547 it will give good swing,
maintain sl- 493
Pivot S2- 515
Target- 684++

SHRIRAM FINANCE LTD S/RSupport and Resistance Levels:
Support Levels: These are price points (green line/shade) where a downward trend may be halted due to a concentration of buying interest. Imagine them as a safety net where buyers step in, preventing further decline.
Resistance Levels: Conversely, resistance levels (red line/shade) are where upward trends might stall due to increased selling interest. They act like a ceiling where sellers come in to push prices down.
Breakouts:
Bullish Breakout: When the price moves above resistance, it often indicates strong buying interest and the potential for a continued uptrend. Traders may view this as a signal to buy or hold.
Bearish Breakout: When the price falls below support, it can signal strong selling interest and the potential for a continued downtrend. Traders might see this as a cue to sell or avoid buying.
MA Ribbon (EMA 20, EMA 50, EMA 100, EMA 200) :
Above EMA: If the stock price is above the EMA, it suggests a potential uptrend or bullish momentum.
Below EMA: If the stock price is below the EMA, it indicates a potential downtrend or bearish momentum.
Trendline: A trendline is a straight line drawn on a chart to represent the general direction of a data point set.
Uptrend Line: Drawn by connecting the lows in an upward trend. Indicates that the price is moving higher over time. Acts as a support level, where prices tend to bounce upward.
Downtrend Line: Drawn by connecting the highs in a downward trend. Indicates that the price is moving lower over time. It acts as a resistance level, where prices tend to drop.
Disclaimer:
I am not a SEBI registered. The information provided here is for learning purposes only and should not be interpreted as financial advice. Consider the broader market context and consult with a qualified financial advisor before making investment decisions.


SHRIRAM FINANCE LTD Swing TradeHello,
Trend-Based Analysis. Buy the Dips, Sell The Rallies, Also Following the Trend. Let's see where the Price Action takes us, Riding the wave. Potential trade setups based on trend momentum.
Technical analysis based on trend identification and momentum, Looking for high-probability setups within the prevailing trend.
Analyzing the current market trend and potential future price movement. Focusing on risk management and reward-to-risk ratios.
Details is Mentioned in Chart, Read carefully.. .

Intraday stocks for today (11/Dec/2024)Technical Analysis of Moving average stocks (11/Dec/2024)
follow us for more updates and information

$SHRIRAMFIN short analysisNSE:SHRIRAMFIN short analysis might play out as in 4h and 1 hour we have down choch
