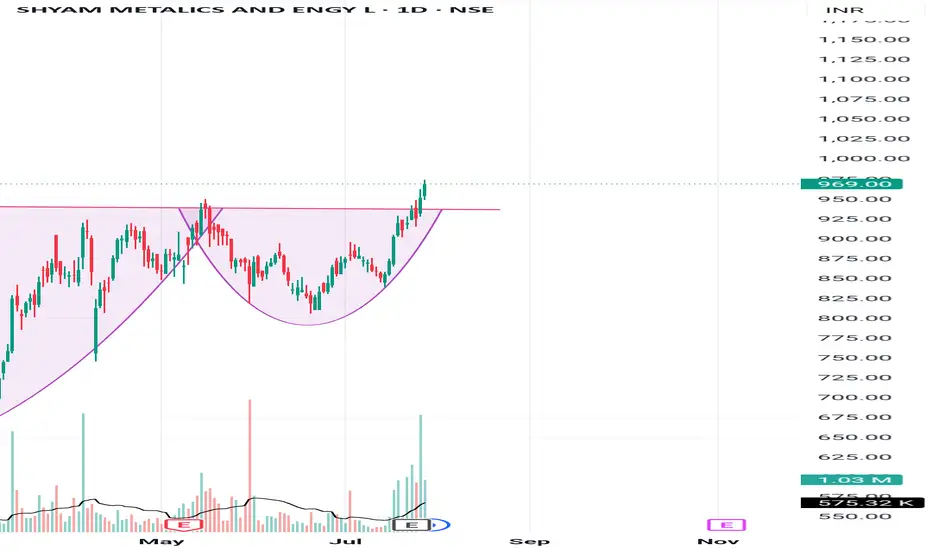
Cup and handle patternBreaks cup and handle pattern and going up. Looks bullish. Make sure to do your own analysis and maintain your risk management. This is only for educational purposes
Next report date
—
Report period
—
EPS estimate
—
Revenue estimate
—
33.20 INR
9.08 B INR
151.02 B INR
61.92 M
About SHYAM METALICS AND ENGY L
Sector
Industry
Website
Headquarters
Kolkata
Founded
2002
ISIN
INE810G01011
FIGI
BBG00MRZ1D68
Shyam Metalics & Energy Ltd. engages in the manufacture and sale of ferro alloys, iron and steel products and power generation. The company was founded on December 10, 2002 and is headquartered in Kolkata, India.
Related stocks
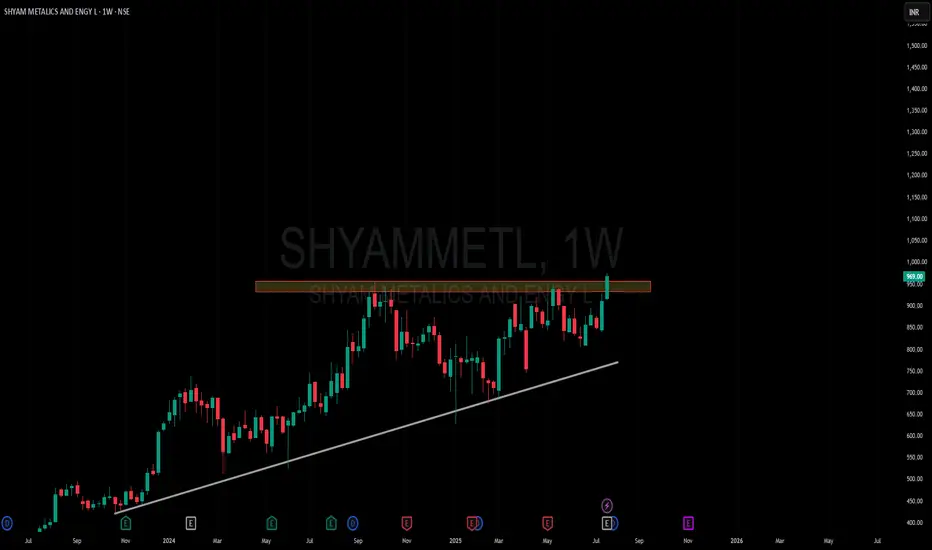
Amazing breakout on WEEKLY Timeframe - SHYAMMETLCheckout an amazing breakout happened in the stock in Weekly timeframe, macroscopically seen in Daily timeframe. Having a great favor that the stock might be bullish expecting a staggering returns of minimum 25% TGT. IMPORTANT BREAKOUT LEVELS ARE ALWAYS RESPECTED!
NOTE for learners: Place the break
bullish for long time now a monthly break outI dont give clear sl due to the holding period , the targets wont justify the sl and so the ideal sl is 7% for me but target can be 12-20%

SHYAM METALICS – Breakout Zone Alert Price is approaching a key resistance zone (~₹950) after breaking out of a descending channel with strong volume and RSI confirmation.
This setup indicates potential bullish continuation.
📌 Trade Plan:
Buy above ₹955
Stoploss: ₹915
Target 1: ₹1,010
Target 2: ₹1,065
Sell below: ₹915 (only if pr

SHYAMMETLSHYAMMETL giving cup & handle breakout with decent increased volume. It is showing strength after recent fall. Now it it sustains above 958 then it may take a fresh ride from hereon. It may take a ride up to 25-27%. Closing below 890 may change my view for it.

Trend is our friend Trendline breakout stockAfter 6 months trendline breakout
50% Momentum is there in this stock as per technical Analysis
take entry with your own technical analysis

SHYAM METALICS AND ENGY LTD Support and Resistance Levels:
Support Levels: These are price points (green line/shade) where a downward trend may be halted due to a concentration of buying interest. Imagine them as a safety net where buyers step in, preventing further decline.
Resistance Levels: Conversely, resistance levels (re

Shyam MetallicsShyam metallics is making a hh/hl structure, script in uptrend with potential of making a new high!

#Shyam Metalics And Energy LtdShyam Metalics And Energy Ltd Breakout Symmetrical Triangle Pattern
Buy - Above 870
Stop Loss - 775
Target - 946 and 1050

Long in SHYAM Metallics1.Good DNA (12-18%)
2. Uptrend, Formed U shape after huge move
3. Good green bars with volumes
4. Good contraction with low volume
5. Best chart pattern compared to peers

See all ideas
Summarizing what the indicators are suggesting.
Neutral
SellBuy
Strong sellStrong buy
Strong sellSellNeutralBuyStrong buy
Neutral
SellBuy
Strong sellStrong buy
Strong sellSellNeutralBuyStrong buy
Neutral
SellBuy
Strong sellStrong buy
Strong sellSellNeutralBuyStrong buy
An aggregate view of professional's ratings.
Neutral
SellBuy
Strong sellStrong buy
Strong sellSellNeutralBuyStrong buy
Neutral
SellBuy
Strong sellStrong buy
Strong sellSellNeutralBuyStrong buy
Neutral
SellBuy
Strong sellStrong buy
Strong sellSellNeutralBuyStrong buy
Displays a symbol's price movements over previous years to identify recurring trends.
Frequently Asked Questions
The current price of SHYAMMETL is 950.65 INR — it has decreased by −1.12% in the past 24 hours. Watch SHYAM METALICS AND ENGY L stock price performance more closely on the chart.
Depending on the exchange, the stock ticker may vary. For instance, on NSE exchange SHYAM METALICS AND ENGY L stocks are traded under the ticker SHYAMMETL.
SHYAMMETL stock has fallen by −1.97% compared to the previous week, the month change is a 11.59% rise, over the last year SHYAM METALICS AND ENGY L has showed a 36.13% increase.
We've gathered analysts' opinions on SHYAM METALICS AND ENGY L future price: according to them, SHYAMMETL price has a max estimate of 1,350.00 INR and a min estimate of 760.00 INR. Watch SHYAMMETL chart and read a more detailed SHYAM METALICS AND ENGY L stock forecast: see what analysts think of SHYAM METALICS AND ENGY L and suggest that you do with its stocks.
SHYAMMETL reached its all-time high on Jul 31, 2025 with the price of 1,001.00 INR, and its all-time low was 254.55 INR and was reached on Mar 29, 2023. View more price dynamics on SHYAMMETL chart.
See other stocks reaching their highest and lowest prices.
See other stocks reaching their highest and lowest prices.
SHYAMMETL stock is 5.30% volatile and has beta coefficient of 1.18. Track SHYAM METALICS AND ENGY L stock price on the chart and check out the list of the most volatile stocks — is SHYAM METALICS AND ENGY L there?
Today SHYAM METALICS AND ENGY L has the market capitalization of 272.94 B, it has increased by 4.73% over the last week.
Yes, you can track SHYAM METALICS AND ENGY L financials in yearly and quarterly reports right on TradingView.
SHYAM METALICS AND ENGY L is going to release the next earnings report on Nov 6, 2025. Keep track of upcoming events with our Earnings Calendar.
SHYAMMETL net income for the last quarter is 2.92 B INR, while the quarter before that showed 2.19 B INR of net income which accounts for 33.55% change. Track more SHYAM METALICS AND ENGY L financial stats to get the full picture.
SHYAM METALICS AND ENGY L dividend yield was 0.53% in 2024, and payout ratio reached 13.78%. The year before the numbers were 0.76% and 11.32% correspondingly. See high-dividend stocks and find more opportunities for your portfolio.
As of Aug 6, 2025, the company has 25.59 K employees. See our rating of the largest employees — is SHYAM METALICS AND ENGY L on this list?
EBITDA measures a company's operating performance, its growth signifies an improvement in the efficiency of a company. SHYAM METALICS AND ENGY L EBITDA is 19.61 B INR, and current EBITDA margin is 12.38%. See more stats in SHYAM METALICS AND ENGY L financial statements.
Like other stocks, SHYAMMETL shares are traded on stock exchanges, e.g. Nasdaq, Nyse, Euronext, and the easiest way to buy them is through an online stock broker. To do this, you need to open an account and follow a broker's procedures, then start trading. You can trade SHYAM METALICS AND ENGY L stock right from TradingView charts — choose your broker and connect to your account.
Investing in stocks requires a comprehensive research: you should carefully study all the available data, e.g. company's financials, related news, and its technical analysis. So SHYAM METALICS AND ENGY L technincal analysis shows the buy rating today, and its 1 week rating is buy. Since market conditions are prone to changes, it's worth looking a bit further into the future — according to the 1 month rating SHYAM METALICS AND ENGY L stock shows the buy signal. See more of SHYAM METALICS AND ENGY L technicals for a more comprehensive analysis.
If you're still not sure, try looking for inspiration in our curated watchlists.
If you're still not sure, try looking for inspiration in our curated watchlists.