SIEMENS LTD Long Term Trend OutlookSIEMENS has maintained a strong multi-year bullish trend since its 2009 low of ₹97.36, consistently respecting a well-anchored ascending channel. After a major rally peaking at ₹4,164.15, price is now reacting to a major supply zone, showing initial signs of distribution.
We should monitor a potential retracement towards the ₹1,400.95 re-accumulation zone, which aligns with the historical demand area and the lower boundary of the long-term trendline. This confluence may provide a high-probability re-entry point for long-term investors seeking continuation exposure.
As long as the macro structure holds above the trendline, the long-term bullish thesis remains intact. A failure below the re-accumulation zone would signal a significant structural shift.
SIEMENS trade ideas

Siemens - 450 points move?Current Price: 2901.5
Upside: 3145.75, 3259.38 and 3373.00
Downside: 2539.75, 2426.13 and 2312.50

Equity Trade Setup – Siemens Ltd. (NSE: SIEMENS)Trade Type: Breakout + Channel Trend Continuation
🔹 Trade Details
Buy Zone (Entry): ₹2,982.00 – ₹2,987.00
Current LTP: ₹2,970.00
Stoploss (SL): ₹2,887.00 (below recent swing support)
Target (T1): ₹3,150.00
Target %: ~5.46%
Timeframe: 3–5 trading days
R:R Ratio: ~2:1
Confidence: Moderate to High (subject to intraday volume confirmation)
For Education Purposes Only

SIEMENS Long for 1 to 3 monthLong for 1 to 3 months. All levels are in chart.
Buy 5143 to 5250
Sl 5012.90
S1 4778.60
S2 4575.35
R1 7930.55
R2 8127.45
Note- exit 50% quantity at 6721.30 and trail stoploss.
Trade close under 8 SMA 2 candle.

Review and plan for 27th March 2025Nifty future and banknifty future analysis and intraday plan.
This video is for information/education purpose only. you are 100% responsible for any actions you take by reading/viewing this post.
please consult your financial advisor before taking any action.
----Vinaykumar hiremath, CMT

SIEMENTS SET AND FORGETwe are currently in no-mans land with no significant demand levels that can push this stock up to the all time highs. We can expect this stock to keep dropping until it reacher the zone marked out, from there we can expect massive amounts of demand kick in and push this stock up.

Siemens bulish bat pattern Siemens bulish bat pattern cmp 5505 on 09.2.25 once reached at demand zone it can reverse to upside

Review and plan for 13th February 2025 Nifty future and banknifty future analysis and intraday plan.
Results.
This video is for information/education purpose only. you are 100% responsible for any actions you take by reading/viewing this post.
please consult your financial advisor before taking any action.
----Vinaykumar hiremath, CMT

SIEMENS KEY LEVELS FOR 24/01/2025**Explanation:**
This trading system helps you avoid blind trades by providing confirmation for better entries and exits.
**Entry/Exit Points:**
- **Entry/Exit Lines:** Use the BLACK line for long trades and the RED line for short trades, based on confirmation from your trading plan.
- **Stop Loss:** For long trades, set the stop loss at the RED line below. For short trades, set it at the BLACK line above.
- **Take Profit:** For long trades, target the next RED line above. For short trades, target the next BLACK line below.
**Timeframe:**
Use a 5 timeframe for trading.
**Risk Disclaimer:**
This setup is for educational purposes. I'm not responsible for your gains or losses. Check the chart for more details.

SIEMENS POSITIONALPrior uptrend
25 weeks long consolidation
Strong sector
Strong RS
Dreied Volume during conolidation
Tightness near resistance
No overhead supply
ABOVE 40 EMA
RISING 40 EMA
ENTRY ABOVE 8000
FOR CONSERVATIVE
TRADER SL IS 20%


Siemens : Bullish trend under threat After a stupendous rally earlier, the stock went into the consolidation and now looking more like a distribution price action. On the pattern front, the stock seems has formed a bearish Trend Reversal Triple Top Price pattern and is near the breakdown from the same.
The decisive breakdown from the pattern would call for trend reversal and bears likely to take control and price to witness profit taking in the coming sessions to come.

Siemens Short TradeHello,
Trend-Based Analysis. Buy the Dips, Sell The Rallies, Also Following the Trend. Let's see where the Price Action takes us, Riding the wave. Potential trade setups based on trend momentum.
Technical analysis based on trend identification and momentum, Looking for high-probability setups within the prevailing trend.
Analyzing the current market trend and potential future price movement. Focusing on risk management and reward-to-risk ratios.
Details is Mentioned in Chart, Read carefully.. .

Siemens at good level?The stock is at a very strong support level with a high probability of bouncing back. This could be an excellent opportunity for a long trade.

Siemens fair value?Expecting siemens to reach level of 7200 in next week
keep it on Rader
as due to heavy selling there will be a good buy side move coming sue to fvp
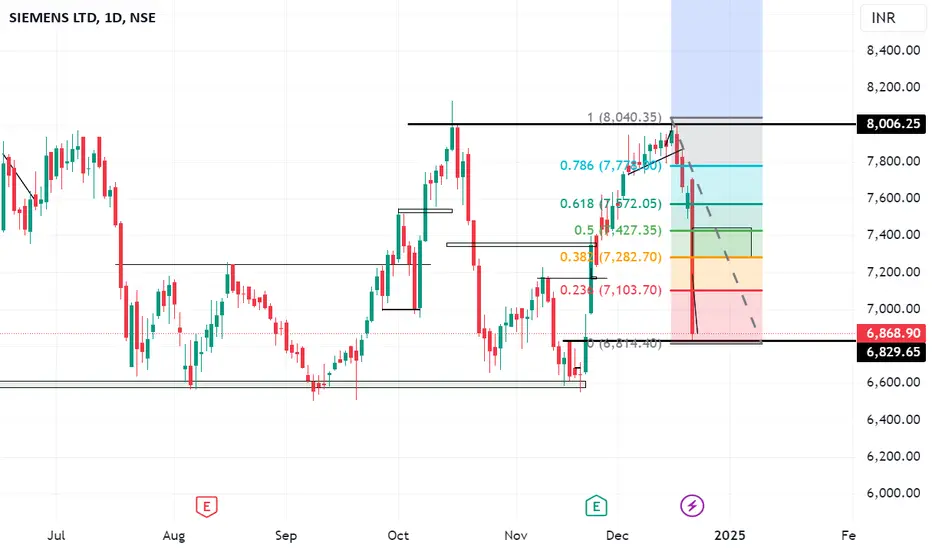
Siemens Ltd - Precision in Analysis!🎯 Siemens Ltd - Precision in Analysis! 📉📊
✅ Our previous analysis played out perfectly! The stock faced a strong rejection near ₹7,958 (key resistance zone), as predicted, and dropped 1.59% today. 🚨
🔍 What Happened?
1️⃣ Wave Structure Completed: The Elliott Wave count signaled the 5th wave top, aligning perfectly with the resistance.
2️⃣ Fibonacci Confluence: The price tested critical Fibonacci zones and reversed exactly where anticipated. 🔄
3️⃣ Technical Weakness: A sharp sell-off today confirms bearish pressure near the resistance area.
📉 Next Levels to Watch:
Support: ₹7,400 – ₹7,200 (Potential retracement area).
Resistance: ₹7,958 (Key supply zone).
🚨 Trading Tip: Watch for bearish follow-through toward lower support zones or any bounce signals around Fibonacci levels. 📈
💡 Engage with us: Share your thoughts in the comments and follow for more accurate setups and insights! 🚀

Simens india- Siemens Ltd - Short Position Technical View### **Siemens Ltd - Short Position Technical View**
#### **Key Observations**:
1. **Wave Structure Analysis**:
- The chart suggests the completion of a **5-wave pattern** as per **Elliott Wave Theory**, indicating a potential **trend reversal** or correction.
- Siemens has reached the **fifth wave high**, which often signals exhaustion in upward momentum.
2. **Resistance Zone**:
- Strong resistance is observed near the ₹7,950–₹8,000 levels, which aligns with the upper Fibonacci arcs and historical resistance.
- Price rejection near this zone could trigger a short-term correction.
3. **Fibonacci Arcs**:
- The chart shows a series of **Fibonacci arcs** acting as dynamic support and resistance levels.
- The price is currently at a critical zone where the **2.618 and 3.618 Fibonacci levels** intersect.
4. **Risk-Reward Setup**:
- A **short position** can be initiated with a stop-loss above ₹8,200 (recent highs).
- Target levels:
- **First target**: ₹7,500 (recent support).
- **Second target**: ₹6,550 (strong support zone indicated in blue).
- Risk/Reward Ratio: Favorable for traders aiming to capitalize on downside potential.
5. **Volume Analysis**:
- Monitor volumes for confirmation. If the price declines with rising volumes, it confirms selling pressure.
6. **Indicators to Watch**:
- **RSI**: Check for bearish divergence; RSI in overbought zones (>70) often suggests a reversal.
- **MACD**: A bearish crossover near resistance would validate the short position further.
---
### **Trade Strategy**:
- **Entry**: Initiate a short position around ₹7,950–₹8,000.
- **Stop-Loss**: ₹8,200 (above key resistance).
- **Targets**:
- **₹7,500** (short-term support).
- **₹6,550** (major support level).
### **Conclusion**:
Siemens Ltd is showing signs of exhaustion near critical resistance levels, with a clear **5-wave structure** and confluence of **Fibonacci arcs**. A short position can be considered with strict stop-loss and predefined targets.

SIEMENS:NSE PRICE ACTION 52W HIGH DTF SWINGSIEMENS Analysis DTF
Chart Pattern :
STOCK has recently TOUCHED its ATH of 7968 with 8 month Bull run . FIBO Retracement bounce back from 61% FOBO and now hovering between 23 to38% indicating a Bullish continuation
INDICATORS EMA :
The Price is Currently Trading below 20EMA, and 20EM crossed above 50EMA in DTF. STOCK EMAs are currently aligned in a ascending order 200 to 20 indicating a bullish Trend on DTF/WTF.
FIBO E :
After the Bounce back 61% FIBO Retracement Level, Price is currently trading near the 23.6% FIBO Retracement level of 6640 on DTF Impulse uptrend with ChoCH at 7260 on DTF
Volumes: are currently flat for the past few weeks..
TRADE PLAN
ENTRY -above 7270 50% qty
ADD 50% above 7950 DTF close
SL -7100
TARGET --01-9400
Hold For a 3-6months
Keep in your Priority Watch List
Disclaimer: For Education/Reference Purpose Only, Trade at your Own Risk with correct position sizing and SL based on your Risk Apetite. Trail Your SL progressively. Wait for Retest after any Breakout in higher Timeframe Learn/Know and Review the Stock trading Technical Terminology. Prefer Entry with 25% quantity, Add in Tranches of 25%-50% as prices moves upwards recommended.Check Verify the Financial fundamentals of the Stock and Seek Advice from a Certified Financial Advisor prior to Investing.
MTFA- Multiple Time Frame Analysis
DTF -Daily Time Frame
WTF-Weekly Time Frame
MTF- Monthly Time Frame
ATH-All Time High
RBC&H-Rounding Bottom Cup/Handle
BO- Breakout Close
EMA -Exponential Moving Average
FIBO R/E -Trend based Fibonacci Retracement/Extension
SL Stop Loss
TBD- To be Decided
CHoCH- Change of Character Bullish/Bearish
MSB/BOS -Break Out Structure
SWING/POSITIONAL Trade

SIEMENS UPDATE As there was Muhurat trading today and market was open for an hour so in this one hour, we can see the stock took a good support from the previous support (6878) its still bullish and from the which we the stock made a fall, there will be a good up movement, if you in it then hold it and wait for the US election result

SIEMENS NSE:SIEMENS
If the stock gives a breakout of 7000 then there can be a good target of 7350 approx 5% and also keeping the U.S election in mind

SIEMENSSiemens looks bearish but trading above its supportif it would breaks might be break next support as well,this is only my view not recomndation.PLEASE KEEP IN MIND.

Siemnse Limited may break its previouse highready to breakout next day its just for educational purpose only.
