SIEMENS S/R Support and Resistance Levels:
Support Levels: These are price points (green line/shade) where a downward trend may be halted due to a concentration of buying interest. Imagine them as a safety net where buyers step in, preventing further decline.
Resistance Levels: Conversely, resistance levels (red line/shade) are where upward trends might stall due to increased selling interest. They act like a ceiling where sellers come in to push prices down.
Breakouts:
Bullish Breakout: When the price moves above resistance, it often indicates strong buying interest and the potential for a continued uptrend. Traders may view this as a signal to buy or hold.
Bearish Breakout: When the price falls below support, it can signal strong selling interest and the potential for a continued downtrend. Traders might see this as a cue to sell or avoid buying.
20 EMA (Exponential Moving Average):
Above 20 EMA: If the stock price is above the 20 EMA, it suggests a potential uptrend or bullish momentum.
Below 20 EMA: If the stock price is below the 20 EMA, it indicates a potential downtrend or bearish momentum.
Trendline: A trendline is a straight line drawn on a chart to represent the general direction of a data point set.
Uptrend Line: Drawn by connecting the lows in an upward trend. Indicates that the price is moving higher over time. Acts as a support level, where prices tend to bounce upward.
Downtrend Line: Drawn by connecting the highs in a downward trend. Indicates that the price is moving lower over time. It acts as a resistance level, where prices tend to drop.
RSI: RSI readings greater than the 70 level are overbought territory, and RSI readings lower than the 30 level are considered oversold territory.
Combining RSI with Support and Resistance:
Support Level: This is a price level where a stock tends to find buying interest, preventing it from falling further. If RSI is showing an oversold condition (below 30) and the price is near or at a strong support level, it could be a good buy signal.
Resistance Level: This is a price level where a stock tends to find selling interest, preventing it from rising further. If RSI is showing an overbought condition (above 70) and the price is near or at a strong resistance level, it could be a signal to sell or short the asset.
Disclaimer:
I am not a SEBI registered. The information provided here is for learning purposes only and should not be interpreted as financial advice. Consider the broader market context and consult with a qualified financial advisor before making investment decisions.
SIEMENS trade ideas


Siemens Uptrend Line Breakout At $82.18. 09.07.2024- Siemens 4HR chart indicates a downside breakout at $82.18.
- If the breakout is sustained, target levels are $72.26 and $71.61.
- If the breakout fails, price may rise to $89.70 and $99.27.
Apply risk management
Risk Warning: Trading in CFDs is highly speculative and carries a high level of risk. It is possible to lose all of your invested capital. These products may not be suitable for everyone, and you should ensure that you fully understand the risks taking into consideration your investment objectives, level of experience, personal circumstances as well as personal resources. Speculate only with funds that you can afford to lose. Seek independent advice if necessary. Please refer to our Risk Disclosure.
BDSwiss is a trading name of BDS Markets and BDS Ltd.
BDS Markets is a company incorporated under the laws of the Republic of Mauritius and is authorized and regulated by the Financial Services Commission of Mauritius ( FSC ) under license number C116016172, address: 6th Floor, Tower 1, Nexteracom Building 72201 Ebene.
BDS Ltd is authorized and regulated by the Financial Services Authority Seychelles (FSA) under license number SD047, address: Suite 3, Global Village, Jivan’s Complex, Mont Fleuri, Mahe, Seychelles. Payment transactions are managed by BDS Markets (Registration number: 143350)
Disclaimer


Siemens India Ltd *Siemens India Ltd*
P&F Formation on Weekly Basis.
Price BreakOut Needed & Sustained. To be Watched. Then Good to go.
Strong Vol Consolidation & Continued Traction.
RSI: 1H>D<W<M. However, all in Bullish Zone
EMAs: Widening Gaps amongst 20/ 50/ 100/ 200 on Weekly Basis.
*Trail SL with Upside*
*Book Profit as per Risk Appetite*
*Do Your Own Research as well. This is an Opinion.*
*_Happy Investing_*🤓


siemens ready for up move siemens ready for up move
weekly cross above
& close above 20 sma
di plus cross di minus
rsi cross his mov avg
daily
retrace above 50 sma

$SIEMENS short idea 6RSpotting a possible NSE:SIEMENS short idea with 6R if it reacts to the weekly supply
This is for educational purposes only . Please consult your financial advisor or do your own analysis before any trades.

Siemens looking good for Upside 3880 1st level to watch On Our Harmonic pattern indicator based trade setup take trade as explained below :-
Early trades Buy or sell below/ above 23.6 %, safe trades buy or sell above / below 41% , after taking trade next upside or downside levels will be target ,
When reverse buy or sell signal appear then book profit on Target or trail SL to 23.6 % If trailing SL hit then early trade can be taken above or below 23.6 and safe trade can b taken above/ below 41% ..
Please note:-
It's working on news based and volitile market very well so exit if SL hit

Short SiemensThere is M pattern breakdown in Siemens on daily chart. Expecting a downward trend in Siemens.

Reversal Ascending Triangle pattern in SIEMENSSIEMENS
Key highlights: 💡
✅On 1 Day Time Frame Stock Showing Reversal of Ascending Triangle Pattern.
✅ It can give movement upto the Reversal final target of below 3600-.
✅There have chances of breakdown of Support level too.
✅ After breakdown of Support level this stock can gives strong downside rally upto below 3000-.


SIEMENSNSE:SIEMENS
One Can Enter Now ! Or Wait for Retest of the Trendline (BO) Or wait For better R:R ratio
Note :
1.One Can Go long with a Strict SL below the Trendline or Swing Low of Daily Candle.
2. Close, should be good and Clean.
3. R:R ratio should be 1 :2 minimum
4. Plan as per your RISK appetite
Disclaimer : You are responsible for your Profits and loss, Shared for Educational purpose

Head and shoulder pattern breakout in SIEMENSSIEMENS INDIA LTD
Key highlights: 💡⚡️
✅On 1Hour Time Frame Stock Showing Breakout of head and shoulder pattern.
✅ Strong Bullish Candlestick Form on this timeframe.
✅It can give movement up to the Breakout target of 3858+.
✅Can Go short in this stock by placing a stop loss above 3695-

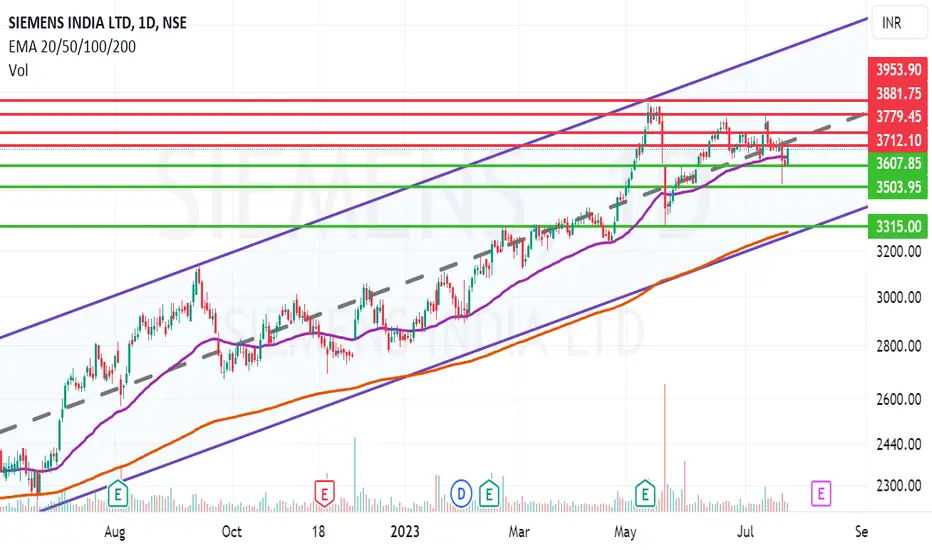
Siemens trying to break the mid channel resistanceSiemens Ltd. is a technology company focused on industry, infrastructure, digital transformation, transport as well as transmission and generation of electrical power. Siemens has signed a 3 billion euro ($3.25 billion) contract to supply and service freight trains in India.
Siemens CMP is 3694.90. Negative aspects of the company are high valuation (P.E. = 69.7), declining cash from operations annual, MFs are decreasing stake. Positive aspects of the company are improving annual net profits, no debt, FIIs are increasing stake and zero promoter pledge.
Entry after closing above 3713. Target of the call will be 3779 and 3881. Long term targets in the stock will be 3953. Stop loss in the stock should be maintained at closing below 3315.
Triangle pattern Reversal in SIEMENSSIEMENS LTD
Key highlights: 💡⚡
📊On 1D Time Frame Stock Showing Reversal of triangle Pattern .
📊 It can give movement upto the Reversal target of Above 3810+.
📊There have chances of Breakout of Resistance level too.
📊 After Breakout of Resistance level this stock can gives strong upside rally upto above 4400+.
📊 Can Go Short in this stock by placing stop loss below 3530- or last swing Low.

Facing resistance at supply zoneSiemens facing resistance at supply zone, some downmove expected from current levels as indicated

SIEMENSNSE:SIEMENS
One can Enter Now or WAIT for Proper BO of the pattern !
Note :
1.One Can Go long with a Strict SL below the Trendline or Swing Low of Daily Candle.
2. Close, should be good and Clean.
3. R:R ratio should be 1 :2 minimum
4. Plan as per your RISK appetite
Disclaimer : You are responsible for your Profits and loss, Shared for Educational purpose!

SIEMENS: All set for next leg of Journey!Siemens ready to breakout from the Top of a Long Term Channel - Buyers are very aggressively pushing the prices up.
"Three Soldiers" pattern in Weekly chart from previous base.
PS: Results due today.
Holding it at from 3000 levels when the stock came out from a pretty good base.
New positions to be taken after consolidation and a break out above the channel.
PS: Think about R:R before any entry is taken.

Siemens is about to reverseSiemens take a trend of angle greater than 80 degree in 1H Time Frame,
And it is about to reverse or retrace to atleast 50% from high
Daily candle RSI- divergence found

Triangle pattern BreakoutPlease look into the chart for a detailed understanding.
Consider these for short-term & swing trades with 2% profit.
For BTST trades consider booking
target for 1% - 2%
For long-term trades look out for resistance drawn above closing.
Please consider these ideas for educational purpose

SIEMENS (27 MARCH 2023)NSE:SIEMENS
Overall trend is bullish in siemens ,its following two major
trendline as support ,below 2688 there may be a chance of bearish
mood.AFTER a long consolidation its going upside by support of trendline.
