SKFINDIA trade ideas
SKF India - LongNSE:SKFINDIA Weekly chart showing positive momentum with currently price located at our location. Breakout and retest near support area.

SKF INDIASKF India Ltd is a leading supplier of products, solutions & services within rolling bearing, seals, mechatronics, and lubrication systems with ROCE OF 20%
Stock is Supporting at Previous Resistance during pull back

SKF trade possibilitiesas shown SKF has delivered 1400 points
after breaking its rectangle zone. estimated points
to gain is 1500 ponts which gives us our first target
of 7061.Overall its a risky trade but then even it is a trade.


StrongBuy #SKFINDIA#StrongBuy #SKFINDIA.
Don't miss this Opportunity.
StrongBuy Candidate. #Stock made Higher high in Monthly and Weekly Timeframe. Now in Best #Retracement point with Strong #Priceaction confirming Reversal.
Buy and Hold for Swing and Shortterm targets.
Follow Risk reward and Stoploss 🛑

Analysis of SKFINDIASupport on Weekly Chart:
The weekly chart for SKFINDIA indicates that the stock has found support on the rising trendline. This is a positive sign, suggesting that there is buying interest in the stock around this level.
RSI Divergence:
The Relative Strength Index (RSI) is showing divergence. Divergence between price and RSI can be an early indication of a potential reversal or a significant move in the price.
Proposed Trade Strategy:
Entry: Consider entering a long position at the current market price (CMP) of 4700, taking advantage of the observed support on the rising trendline and the RSI divergence.
Stop Loss (SL): Implement a stop loss at 4450 to manage risk and protect against unexpected adverse price movements.
Target: Set a target at 5080, based on the assumption that the stock may experience a positive move, as suggested by the technical analysis.
Conclusion:
The technical analysis indicates a potential bullish opportunity for SKFINDIA, with support found on the rising trendline and RSI divergence pointing to possible strength in the upward move. However, it's important to conduct additional research, consider broader market conditions, and apply risk management principles before making any trading decisions.
As with any investment, there are risks involved, and it's advisable to seek guidance from a financial advisor or conduct thorough research based on your risk tolerance and investment objectives.

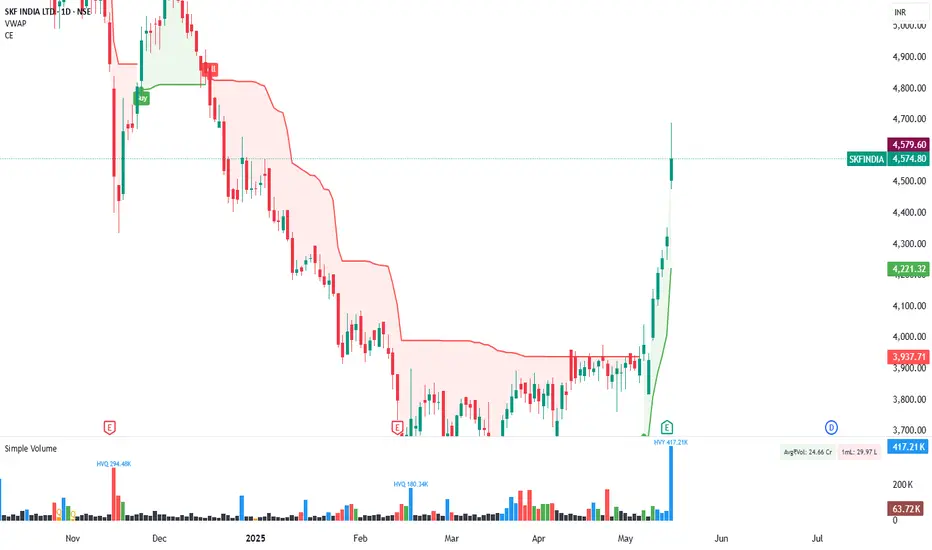
TRADE_SETUP_20% UPSIDE IN SKFINDIAThe stock was seen bouncing off an active support/resistance zone of INR4350-4450.
This very zone has been an active zone for the stock since Aug.2022, with several attempts made by both buyers and sellers to breach it.
The sellers in fact were able to breach this zone in March 2023 but looks like the buyers would not give up even then.
After a tough battle of 1.5months the buyers not only brought the price back above the S/R zone but managed to ignite a 35% rally to the upside.
The stock after finding a new supply zone at INR5250-5350 was back to the previously active zone of INR 4350-4450 and was seen reversing quite sharply from the past 3 trading sessions.
Now one should keep an eye at 4700 as once the stock is able to close above this mark the rally could get even stronger and the buyers could target the IBR 5800-6000 zone this time around.
CMP - 4675
SL - 4500
Target1 - 5350
Target 2 - 5800(RR 1:5)


SKFINDIA CASH NSESKFINDIA looks good for short term investment...SKF India Ltd is a leading supplier of products, solutions & services within rolling bearing, seals, mechatronics, and lubrication systems

SKF can slip to 3125 levels!Stock appears to have started the 4th wave correction of higher cycle!
correction can be 50% and time consuming, considering that the 2nd wave correction was 50% and quick.
Seeing a level of 3125.
I can be wrong!

SKFINDIA Breaks the channel #LONGSKFINDIA Breaks the channel and gives a retrace and breaks the retrace hive so we can go for LONG (BUY) stoploss below retrace low


SKFINDIANSE:SKFINDIA
Please note that we are not a SEBI Registered Investor Adviser/PMS/ Broking House.
All the contents over here are for educational purposes only and are not investment advice or recommendations
offered to any person(s) with respect to the purchase or sale of the stocks / futures and options.
You are also requested to apply your prudence and consult your advisers in case you choose to act on
any such content available as WE claims no responsibilities for any of your actions or any outcome of
such actio

#SKFINDIA #NIFTY #BANKNIFTY #Iot #IT #NFT #ML #muhurattradingSKF India Ltd.
NSE:SKFINDIA
NSE:SKFINDIA
CMP: 3519
Target 1: 3800+
Target 2: 4500+
Time frame: <6months
Factors:
BULLISH WEDGE BREAKOUT
Trend Following
Rising Volume with rising Prices.
Flag pattern breakout.
Pennant Pattern Breakout with Bullish Candle.
Retest Successful.
Higher Highs & Higher Lows.
Broken above RESISTANCE levels
Trading at SUPPORT levels
Earnings are strong.
Bullish Wedge Breakout
Risk Return Ratio is healthy.
And
Rising from Double Bottom Pattern to Flag Pattern forming.
If you like my work KINDLY LIKE SHARE & FOLLOW this page for free Stock Recommendations.
With 💚 from Rachit Sethia


SKF INDIA(flag and pole pattern)It rallied for some days and then consolidated in a falling flag now it had broken from the bullish flag with a good volume this is pure price action only no indicators are invloved

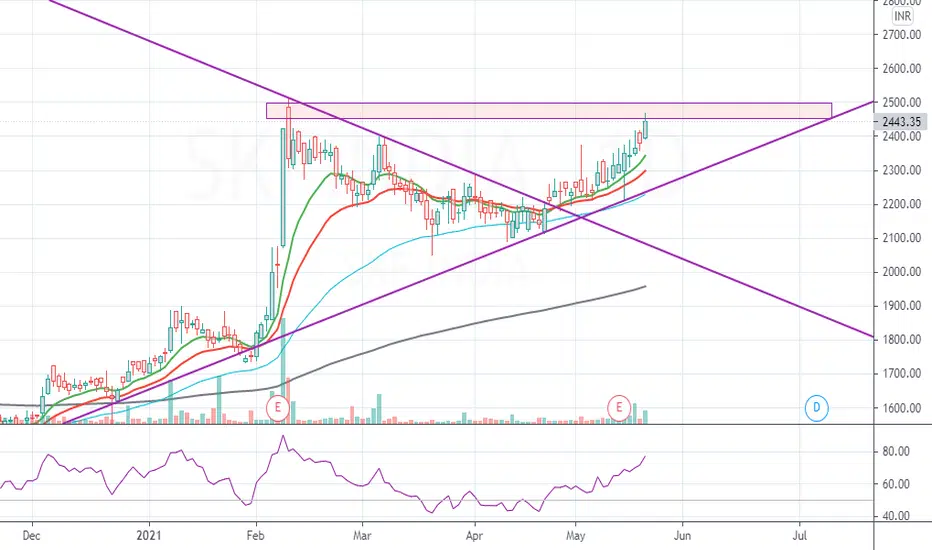
Cup & handle and moving upThis is for educational purposes....this is a cup & handle and one can see how it moves up nicely ( shown by arrow). but you could see it go up to 2846...of course market is king and if the broader market is steady it will happen..in any case it has moved up

SKF - Time to Buy Again ??Fundamental company, around 2750 price - should be support level, keep in watch list,