Skipper Ltd Elliot Wave Theory
Looks Great for a Target of 600-620+
Can be added on Dips till 505 Levels
SKIPPER trade ideas

SKIPPER IS LOOKING TO BOUNCERelative Strength looks poised to breakout. Stock has been consolidating after a good run, looking to take the lead again. Some good candles coming in today along with strong volume. Bullish Engulfing candles are always a sight for the sore eyes. Will be eyeing this closely over the next few months.

SKIPPER BULLISH FLAG FORMEDThere is a Bullish Flag formed and near the breakout. If breakout happens, we can see 20% upside move.

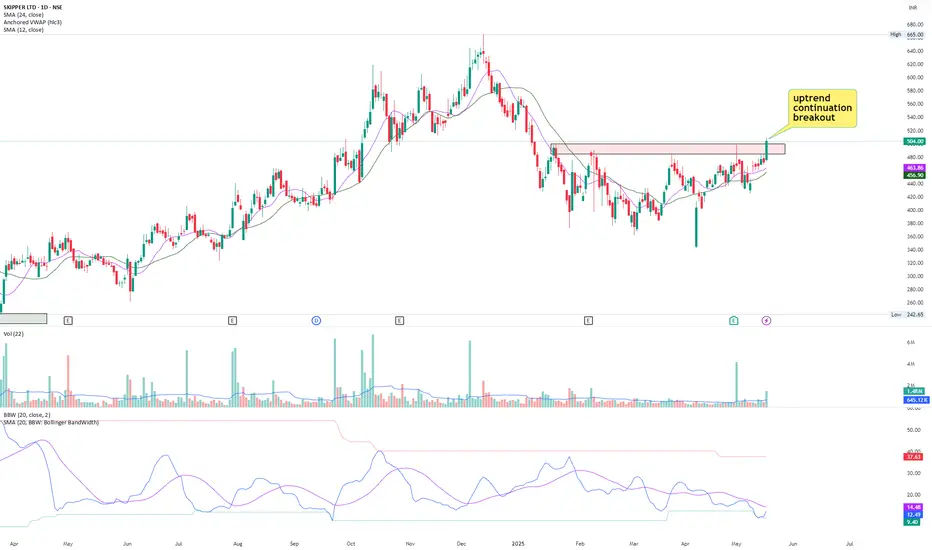
Breakout in SkipperStock has broken out of range of 4 months in long term uptrend with high relative volume.
Fundamentally, stock has delivered double digit earnings growth for straight 4 quarters.
Margins have also been increasing for last 3 quarters.
Overall, it's a good technofunda pick to watch out for.
Volume drift// This work is licensed under Creative Commons Attribution-NonCommercial-ShareAlike 4.0 International
// creativecommons.org
// © BigBeluga
//@version=6
indicator('Volatility Drift ', 'Volatility Drift ', overlay = true, max_lines_count = 500, max_labels_count = 500)
// INPUTS ――――――――――――――――――――――――――――――――――――――――――――――――――――――――――――――――――――――――――――――――――――――――――――――――――――――――{
// Input parameters for length, momentum, and source data
int vd_length = input.int(10, 'VD Length') // Length of the VD calculation
int vd_momentum = input.int(20, 'VD Momentum') // Momentum length for VD
float band_distance = input.float(2, 'Distance factor for upper/lower bands', step = 0.1) // Distance factor for upper/lower bands
// Define pivot parameters
int pivot_left_bars = 3 // Left side pivot bars
int pivot_right_bars = pivot_left_bars // Right side pivot bars
float source = input.source(close, 'Source') // Source for vd calculation
// Define colors for up and down trends
color up_trend_color = input(#17dfad, '+', group = 'Color', inline = 'c') // Color for uptrend
color down_trend_color = input(#dd326b, '-', group = 'Color', inline = 'c') // Color for downtrend
bool shadow = input.bool(true, 'Shadow', group = 'Color', inline = 'c')
// Initialize variables for line, volume, and trend state
var line pivot_line = na // Variable for storing line references
var float volume_value = na // Variable for storing volume data
float smoothed_value = na // Smoothing variable for vd trend levels
var bool is_trend_up = false // Boolean variable for tracking trend direction
// Initialize arrays for storing line and volume information
var array liquidity_lines_low = array.new(500) // Array for storing lines for lows
var array liquidity_lines_high = array.new(500) // Array for storing lines for highs
var float up_trend_volume = na // Volume accumulated during uptrend
var float down_trend_volume = na // Volume accumulated during downtrend
// }
// FUNCTIONS―――――――――――――――――――――――――――――――――――――――――――――――――――――――――――――――――――――――――――――――――――――――――――――――――――――――――――――{
// Define vd (Variable Index Dynamic Average) function
vd_calc(src, vd_length, vd_momentum) =>
float momentum = ta.change(src)
float sum_pos_momentum = math.sum(momentum >= 0 ? momentum : 0.0, vd_momentum)
float sum_neg_momentum = math.sum(momentum >= 0 ? 0.0 : -momentum, vd_momentum)
float abs_cmo = math.abs(100 * (sum_pos_momentum - sum_neg_momentum) / (sum_pos_momentum + sum_neg_momentum))
float alpha = 2 / (vd_length + 1)
var float vd_value = 0.0
vd_value := alpha * abs_cmo / 100 * src + (1 - alpha * abs_cmo / 100) * nz(vd_value )
ta.sma(vd_value, 15)
// Method to extend lines and add labels for liquidity levels
method extend_liquidity_lines(array line_array, float price_level, bool is_cross, volume_val) =>
if line_array.size() > 0 and last_bar_index - bar_index < 5000
for i = 0 to line_array.size() - 1 by 1
if i < line_array.size()
line liquidity_line = line_array.get(i)
float current_line_level = line.get_y2(liquidity_line)
bool price_cross = is_cross ? price_level < current_line_level and price_level >= current_line_level : price_level > current_line_level and price_level <= current_line_level
bool is_short_line = bar_index - line.get_x1(liquidity_line) < 50
if price_cross and is_short_line
line.set_x2(liquidity_line, bar_index)
line_array.remove(i)
// Add volume label to the liquidity zone
label.new(bar_index - 1, price_level , str.tostring(volume_val, format.volume), color = color.rgb(0, 0, 0, 99), style = is_cross ? label.style_label_lower_left : label.style_label_upper_left, textcolor = chart.fg_color, size = size.small)
// Add a circle label to represent liquidity zone
label.new(bar_index - 1, price_level , text = '◉', color = #00000003, textcolor = is_cross ? down_trend_color : up_trend_color, style = label.style_label_center, size = size.normal)
// }
// CALCULATIONS――――――――――――――――――――――――――――――――――――――――――――――――――――――――――――――――――――――――――――――――――――――――――――――{
// Calculate the Average True Range (ATR)
float atr_value = ta.atr(200) // ATR calculation with length of 200
// Calculate the vd (Variable Index Dynamic Average)
vd_value = vd_calc(source, vd_length, vd_momentum)
// Calculate upper and lower bands based on vd and ATR
float upper_band = vd_value + atr_value * band_distance
float lower_band = vd_value - atr_value * band_distance
// Detect trend direction using crossovers of source with bands
if ta.crossover(source, upper_band)
is_trend_up := true
is_trend_up
if ta.crossunder(source, lower_band)
is_trend_up := false
is_trend_up
// Set trend-based smoothing variable
if is_trend_up
smoothed_value := lower_band
smoothed_value
if not is_trend_up
smoothed_value := upper_band
smoothed_value
if ta.change(is_trend_up)
smoothed_value := na
smoothed_value
// Calculate pivot highs and lows for price action
bool pivot_high = not na(ta.pivothigh(pivot_left_bars, pivot_right_bars))
bool pivot_low = not na(ta.pivotlow(close, pivot_left_bars, pivot_right_bars))
// Create and store lines for pivot lows (support zones)
if low > smoothed_value and pivot_low
pivot_line := line.new(bar_index , low , bar_index + 5, low , color = color.new(up_trend_color, 50))
liquidity_lines_low.push(pivot_line)
volume_value := math.sum(volume, pivot_right_bars + pivot_left_bars) / (pivot_right_bars + pivot_left_bars)
volume_value
// Create and store lines for pivot highs (resistance zones)
if high < smoothed_value and pivot_high
pivot_line := line.new(bar_index , high , bar_index + 5, high , color = color.new(down_trend_color, 50))
liquidity_lines_high.push(pivot_line)
volume_value := math.sum(-volume, pivot_right_bars + pivot_left_bars) / (pivot_right_bars + pivot_left_bars)
volume_value
// Extend lines to track price movements
liquidity_lines_high.extend_liquidity_lines(smoothed_value, true, volume_value)
liquidity_lines_low.extend_liquidity_lines(smoothed_value, false, volume_value)
// Detect changes in the trend direction
bool trend_cross_up = not is_trend_up and is_trend_up
bool trend_cross_down = not is_trend_up and is_trend_up
// Reset volume counters when trend changes
if ta.change(trend_cross_up) or ta.change(trend_cross_down)
up_trend_volume := 0
down_trend_volume := 0
down_trend_volume
// Accumulate volume during trends
if not(ta.change(trend_cross_up) or ta.change(trend_cross_down))
up_trend_volume := up_trend_volume + (close > open ? volume : 0)
down_trend_volume := down_trend_volume + (close < open ? volume : 0)
down_trend_volume
// Calculate average volume
float avg_volume_Drift = (up_trend_volume + down_trend_volume) / 2
// Determine the color of the trend
color trend_color = is_trend_up ? up_trend_color : not is_trend_up ? down_trend_color : chart.fg_color
// Calculate Drift volume percentage
string Drift_volume = str.tostring((up_trend_volume - down_trend_volume) / avg_volume_Drift * 100, format.percent) == 'NaN%' ? '0%' : str.tostring((up_trend_volume - down_trend_volume) / avg_volume_Drift * 100, format.percent)
// }
// PLOT ――――――――――――――――――――――――――――――――――――――――――――――――――――――――――――――――――――――――――――――――――――――――――――――――――――――――――――{
// Display labels for volume and trend statistics on the last bar
if barstate.islast
label.delete(label.new(bar_index, smoothed_value, 'Buy: ' + str.tostring(up_trend_volume, format.volume) + ' Sell: ' + str.tostring(down_trend_volume, format.volume) + ' Drift Volume: ' + Drift_volume, color = color.new(trend_color, 90), style = is_trend_up ? label.style_label_upper_left : label.style_label_lower_left, textcolor = chart.fg_color) )
label.delete(label.new(bar_index, smoothed_value, text = '✪', color = #00000003, textcolor = trend_color, style = label.style_label_center, size = size.large) )
// Plot the vd trend line
p1 = plot(smoothed_value, color = trend_color, linewidth = 2, style = plot.style_linebr)
p2 = plot(hl2, display = display.none)
// Fill between the plot and the vd line
fill(p1, p2, smoothed_value, hl2, color.new(trend_color, shadow ? 80 : 100), na)
// Plot trend change markers (up and down arrows)
plotshape(series = trend_cross_up ? smoothed_value : na, title = 'Trend Up', style = shape.labelup, location = location.absolute, color = color.new(up_trend_color, 50), text = '▲', textcolor = chart.fg_color)
plotshape(series = trend_cross_down ? smoothed_value : na, title = 'Trend Down', style = shape.labeldown, location = location.absolute, color = color.new(down_trend_color, 50), text = '▼', textcolor = chart.fg_color)
// }

Darvas Box Strategy - Break out Stock - Swing TradeDisclaimer: I am Not SEBI Registered adviser, please take advise from your financial adviser before investing in any stocks. Idea here shared is for education purpose only.
Stock has given break out. Buy above high. Keep this stock in watch list.
Buy above the High and do not forget to keep stop loss, best suitable for swing trading.
Target and Stop loss Shown on Chart. Risk to Reward Ratio/ Target Ratio 1:1
Stop loss can be Trail when it make new box / Swing.
Be Discipline, because discipline is the key to Success in Stock Market.
Trade what you See Not what you Think.

SKIPPER LTD S/R Support and Resistance Levels:
Support Levels: These are price points (green line/shade) where a downward trend may be halted due to a concentration of buying interest. Imagine them as a safety net where buyers step in, preventing further decline.
Resistance Levels: Conversely, resistance levels (red line/shade) are where upward trends might stall due to increased selling interest. They act like a ceiling where sellers come in to push prices down.
Breakouts:
Bullish Breakout: When the price moves above resistance, it often indicates strong buying interest and the potential for a continued uptrend. Traders may view this as a signal to buy or hold.
Bearish Breakout: When the price falls below support, it can signal strong selling interest and the potential for a continued downtrend. Traders might see this as a cue to sell or avoid buying.
20 EMA (Exponential Moving Average):
Above 20 EMA(50 EMA): If the stock price is above the 20 EMA, it suggests a potential uptrend or bullish momentum.
Below 20 EMA: If the stock price is below the 20 EMA, it indicates a potential downtrend or bearish momentum.
Trendline: A trendline is a straight line drawn on a chart to represent the general direction of a data point set.
Uptrend Line: Drawn by connecting the lows in an upward trend. Indicates that the price is moving higher over time. Acts as a support level, where prices tend to bounce upward.
Downtrend Line: Drawn by connecting the highs in a downward trend. Indicates that the price is moving lower over time. It acts as a resistance level, where prices tend to drop.
RSI: RSI readings greater than the 70 level are overbought territory, and RSI readings lower than the 30 level are considered oversold territory.
Combining RSI with Support and Resistance:
Support Level: This is a price level where a stock tends to find buying interest, preventing it from falling further. If RSI is showing an oversold condition (below 30) and the price is near or at a strong support level, it could be a good buy signal.
Resistance Level: This is a price level where a stock tends to find selling interest, preventing it from rising further. If RSI is showing an overbought condition (above 70) and the price is near or at a strong resistance level, it could be a signal to sell or short the asset.

Volume Breakout - Swing TradeDisclaimer: I am not a Sebi registered adviser.
This Idea is publish purely for educational purpose only before investing in any stocks please take advise from your financial adviser.
Volume Breakout. Stock has give Breakout with Volume. Keep in watch list. Buy above the high. Suitable for Swing Trade. Stop loss & Target Shown on Chart. Exit With in 5 to 10 Days
Be Discipline because discipline is the Key to Success in the STOCK Market.
Trade What you see not what you Think

SKIPPER potential breakout Good Quarterly Earnings.
6 Months Base.
Forming higher lows.
Consolidating outside the base near ATH.
Can give a good move if broader market breadth turns positive.

Skipper Ready for Double Skip :)Skipper had a Blast of nearly 15% today and ended right at the BO zone of Multi year Rounding Bottom BO
On Daily Chart - there is a Cup and Handle Pattern with same BO zone. Above 275 WCB for target of 340
On Monthly Chart - There is a Rounding Bottom pattern with BO above same 275 WCB for Target of 530 almost 2x from CMP
Disclaimer:
Stocks-n-Trends is NOT a SEBI registered company. We do not provide Buy / Sell recommendations - rather we provide detailed analysis of how to review a chart, explain multi--timeframe views purely for Educational Purposes. We strongly suggest our followers to "Learn to Ride the Tide" and consult your Financial Advisors before taking any positions.
If you like our detailed analysis, please do rate us with your Likes, Boost and share your comments
-Team Stocks-n-Trends

SKIPPERThese are swing ideas which you can add your watchlist and analysis for yourself !
Keep on your radar!


Downtrendline BreakoutStock has broken the downtrendline, buy at 73 for a target of 270.65, accumulate till 69

Skipper Looks Ready for the Next Big RallyVCP
Strong Uptrend
Excellent Quarterly Results
Amazing Risk Reward
SL: 179 (Closing Basis)
Target 1: 240 (25% from CMP)
Target 2: 270

SkipperSkipper Ltd is engaged in manufacturing and selling of Transmission & Distribution Structures and Pipes & Fittings. It also undertakes EPC projects in the infrastructure segment.
This has already given a good runup and has also consoldiated at 200 levels for almost a 90 days.
A high risk reward trade where the SL is 220 and the targets are as marked on the chart
More volumes are seen and breakout of Gann levels are positives

⭐️#SKIPPER Ready for a potential breakout !Price: ₹ 170.5
💡Fair amount of contraction seen on daily chart.
💡70% upthrust seen in stock recently.
💡Stock Trading above 20 & 50 EMA
💡Breakout above 180 Support 170-72
Don't forget to hit that❤️for a like🔁for a share,and🔖for a bookmark!

Cup and Handle Pattern Bullish PatternSkipper Ltd. looks bullish
Height of the Cup from the resistance is the target from the breakout

SKIPPER LTD - close/possible breakoutCMP 90.70 | Possible breakout | High Volume | Positive indicators
- Key level 94
- Rounding bottom
- Close to multiyear breakout
*Not recommendation

Skipper Formed Bull Flag Pattern in last 2 years. Recent trend is bearish, it has formed Descendant triangle. Need to break the upper trend line to reverse the trend and bullish breakout.


Long setup in SkipperThe stock is in upward trend and currently at support level of the trendline, resistance near 72 is the key, once broken then could reach 180, SL: 48.
Disclaimer: The stock/index/currency discussed do not constitute Investment/trading advise and is merely an effort towards enhancing learning, knowledge and book keeping. Kindly do your own due diligence and/or consult investment advisor before making any investment/trading decisions


Nifty & banknifty levels for tommorow Expiry (02-07-20)Nifty & banknifty levels for tommorow Expiry (02-07-20)
