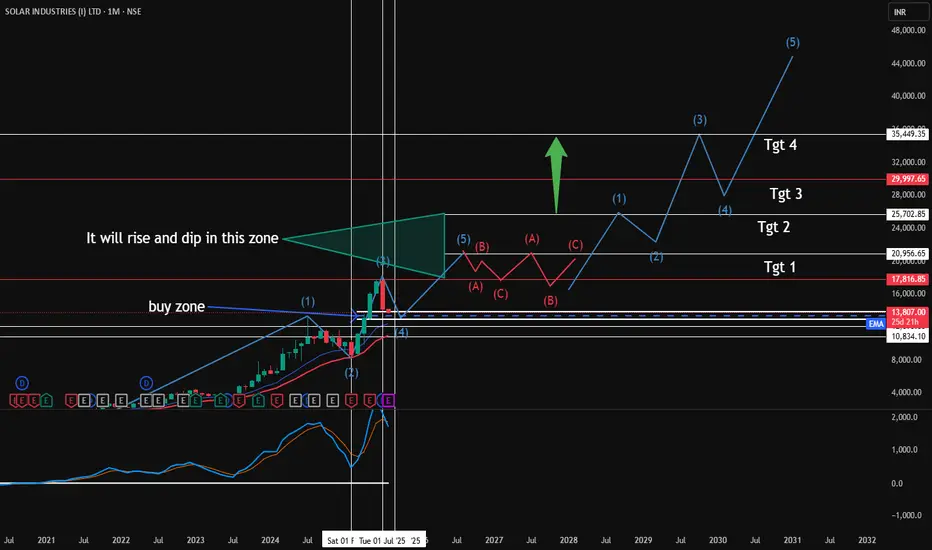
Share over view of long term 10 yearsExpected path and view.
This for educational purpose only. Not buying or selling recomendation
SOLARINDS trade ideas
SOLAR IND🛒 Trade Plan: Buy Setup
Parameter Value
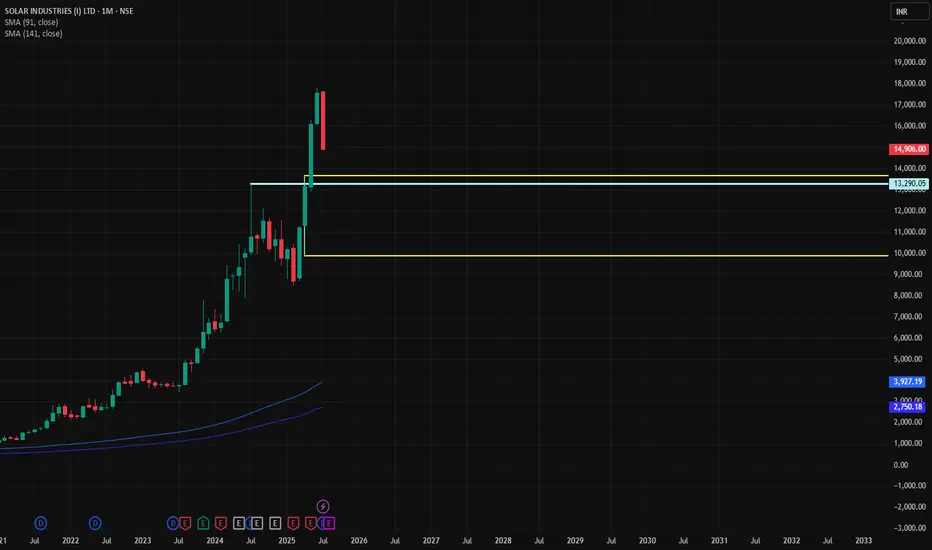
Entry 13,290
Stop Loss 11,278
Target 18,992
Risk 2,012 pts
Reward 5,702 pts
Risk-Reward 2.8 : 1
Last High 16,141
Last Low 13,290
Point Variance 2,851
🧠 Logic:
Entry is placed right at strong demand cluster on HTF & Weekly.
SL is just below the major Weekly/ITF zone.
Target is well above last swing high, offering strong RR.
DMIP (Demand Momentum Imbalance Points) on Daily & Intraday (60/180/240 mins) further supports bullish continuation.
✅ Verdict
High-conviction long trade supported by all major timeframes.
Strong demand confluence around 13,290 and below.
Maintain discipline at SL (11,278), and consider trail SL after price crosses 16,141 (previous high) for profit protection.
SOLARINDSNSE:SOLARINDS
Note :
1. One should go long with a Stop Loss, below the Trendline or the Previous Swing Low.
2. Risk :Reward ratio should be minimum 1:2.
3. Plan your trade as per the Money Management and Risk Appetite.
Disclaimer :
>You are responsible for your profits and loss.
>The idea shared here is purely for Educational purpose.
>Follow back, for more ideas and their notifications on your email.
>Support and Like incase the idea works for you.


Review and plan for 4th December 2024 Nifty future and banknifty future analysis and intraday plan.
This video is for information/education purpose only. you are 100% responsible for any actions you take by reading/viewing this post.
please consult your financial advisor before taking any action.
----Vinaykumar hiremath, CMT

SOLAR INDUSTRIES S/R Support and Resistance Levels:
Support Levels: These are price points (green line/shade) where a downward trend may be halted due to a concentration of buying interest. Imagine them as a safety net where buyers step in, preventing further decline.
Resistance Levels: Conversely, resistance levels (red line/shade) are where upward trends might stall due to increased selling interest. They act like a ceiling where sellers come in to push prices down.
Breakouts:
Bullish Breakout: When the price moves above resistance, it often indicates strong buying interest and the potential for a continued uptrend. Traders may view this as a signal to buy or hold.
Bearish Breakout: When the price falls below support, it can signal strong selling interest and the potential for a continued downtrend. Traders might see this as a cue to sell or avoid buying.
20 EMA (Exponential Moving Average):
Above 20 EMA(50 EMA): If the stock price is above the 20 EMA, it suggests a potential uptrend or bullish momentum.
Below 20 EMA: If the stock price is below the 20 EMA, it indicates a potential downtrend or bearish momentum.
Trendline: A trendline is a straight line drawn on a chart to represent the general direction of a data point set.
Uptrend Line: Drawn by connecting the lows in an upward trend. Indicates that the price is moving higher over time. Acts as a support level, where prices tend to bounce upward.
Downtrend Line: Drawn by connecting the highs in a downward trend. Indicates that the price is moving lower over time. It acts as a resistance level, where prices tend to drop.
RSI: RSI readings greater than the 70 level are overbought territory, and RSI readings lower than the 30 level are considered oversold territory.
Combining RSI with Support and Resistance:
Support Level: This is a price level where a stock tends to find buying interest, preventing it from falling further. If RSI is showing an oversold condition (below 30) and the price is near or at a strong support level, it could be a good buy signal.
Resistance Level: This is a price level where a stock tends to find selling interest, preventing it from rising further. If RSI is showing an overbought condition (above 70) and the price is near or at a strong resistance level, it could be a signal to sell or short the asset.
Disclaimer:
I am not a SEBI registered. The information provided here is for learning purposes only and should not be interpreted as financial advice. Consider the broader market context and consult with a qualified financial advisor before making investment decisions.

Solarinds - Narrow RangeSolar Industries India Ltd.
Crossing Last month high.
Consolidation in a narrow range in daily timeframe.
Breakout above narrow range with good volume will be a good entry point.
Disclaimer:
For educational purpose only.
Please do your own research before taking any trades.
Happy Trading!

Solar Industries Ready for Breakout!➡️ Resistance at ₹11,196.15 - Bullish Breakout Expected
➡️ Strong support from the ascending trend line
➡️ Targets: ₹12,666.15 and ₹13,285.10

SOLAR INDUSTRIES may touch All Time High Level. NSE:SOLARINDS trade at 11000 level. You can watch for next resistance at All Time High 13000 level...

SOLARINDS | SWING LONG | BULLISH PRICE ACTIONSOLARINDS is creating a base at ATH, price is being followed by 20 EMA and volume dry up is pretty nice, It needs to create a third leg to create a perfect VCP or contract near highs at lower TF to execute an entry.

Solar industries looks good for 9k++After testing a support ,stock could test a new high
Low volume now
Target9200
Stop8600
Risk reward 1:22
Solar Industries is one of the worlds leading manufactures bulk explosives, packaged explosives and initiating systems, which find applications in the mining, infrastructure and construction industries.
SIL also ventured into the defense segment in 2010 and diversified into manufacturing of propellants for missiles and rockets, warheads and warhead explosives.
Only for educational purpose.
Consult an expert before buy or sell.

Bullish Short-Term Outlook for SOLARIS INDUSTRIES (SOLARINDS)Disclaimer: This blog post reflects my analysis and is not a trade recommendation. It presents a short-term bullish view on SOLARIS INDUSTRIES (SOLARINDS) based on past performance and a volatility model. Investors are encouraged to conduct their research or seek advice from financial professionals before making any investment decisions.
I've been closely monitoring SOLARIS INDUSTRIES (SOLARINDS) , a stock actively traded on both the NSE and BSE, and I'm excited to share my short-term bullish perspective for the next four weeks. In this analysis, I'll discuss key entry points, stop-loss levels, potential downside risks, and target levels based on my research and proprietary volatility model.
As of Friday, 15-03-2024, SOLARINDS closed at 8855.50. My analysis indicates that entering the market below 8744.35 presents a favorable risk-reward opportunity. Therefore, I plan to initiate my position below this level, keeping a strict stop-loss at 7688.15 to manage risk and protect against potential downside movements.
Should the stock fall below the stop-loss level, there is a possibility it could slide further down to 6532.35. This underscores the importance of implementing disciplined risk management strategies, especially in volatile market conditions.
My target price for SOLARINDS is set at 10000 levels by 12th April 2024, reflecting my optimistic outlook on its short-term potential. This target is derived from my volatility model, which indicates a theoretical Implied Volatility of 135.7% at the 10000 level. However, I acknowledge that targets are projections subject to market dynamics and may change over time.
Taking into account historical volatility data, SOLARINDS has shown an Annualized historical volatility of 46.23% as of 15th March 2024, based on information from the NSE Website. This metric provides valuable insights into price fluctuations and informs my risk management approach.
It's important to note that trading in volatile markets carries inherent risks, and I emphasize the importance of thorough research and disciplined risk management in my trading strategies. While I'm optimistic about SOLARINDS' short-term prospects, I urge investors to consider their own investment goals and consult with financial professionals before making any trading decisions.
In conclusion, my short-term bullish outlook on SOLARIS INDUSTRIES (SOLARINDS) is based on a combination of past performance analysis and my proprietary volatility model. I remain vigilant and adaptable to market changes, always prioritizing risk management and prudent decision-making in my trading activities.

Solar industries CMP 8145
Sl 7150 - keep risk in control sl is high
5 star setup in this kind of market
Targets 20%+

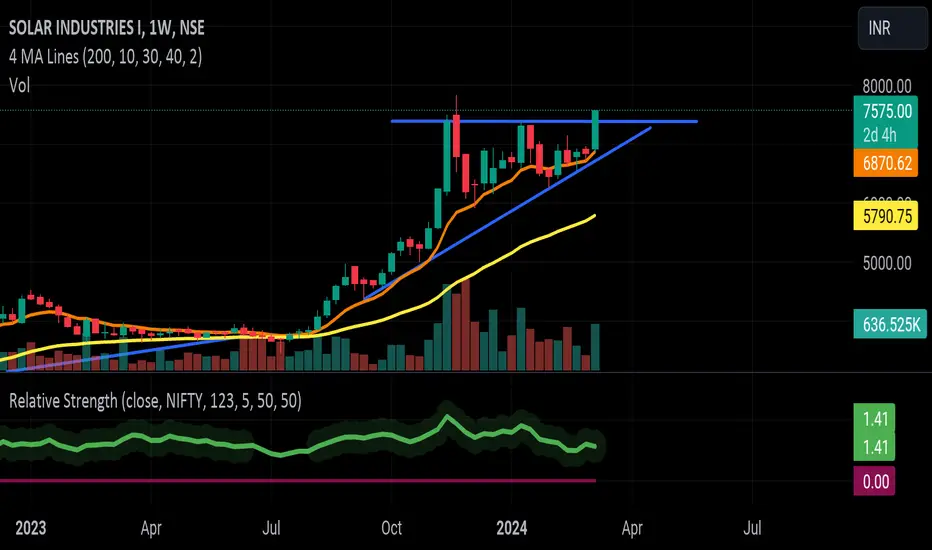
SOLAR INDUSTRIESBreakout happend in this stock with rising 50 and 200 day moving averages and rs indicator is also showing strength.
Keep your risk and reward ratios according to your own preferances.
This is for educational purpose, do your own research before investing.

Triangle Patten Breakout in SOLARINDSSolar Industries India Ltd. manufactures, supplies and exports industrial explosives and initiating systems. Its commercial and civil explosives include bulk explosives, cartridges, detonators, and initiating systems. The company was founded by Satyanarayan Nandlal Nuwal on February 24, 1995, and is headquartered in Nagpur, India.
We can Aim for a 25-30% return with a StopLoss of 10% @6555.

Beautiful time cycle on SOLARINDSSolar Inds just gave a time cycle bottom and has also broken out of the contracting triangle that it was trapped in for the past few weeks
Expecting fireworks soon

Solarinds all coiled up. Ready for an explosive move 🧨Stock has made beautiful VCP pattern and Volatility and volume have both dried up suggesting that there may be no more sellers left. The Q3 result has also been declared. One can also see a clear triangle pattern although the stock has not broken out. To me it looks set to make new highs.

Solar industries VCP WITH contracting on low volumes base reset once crosses the resistance then good for long with good RISK/REWARD

Short Term Bullish View Short Term Bullish View on Solar Indu
Educational Purpose only
2 Months Duration

💥Solar Industries 💥-Nice Breakout💥Solar Industries 💥-Nice Breakout
Capital to be deployed- 20k
Investing Price -5650-5680
Breakout Price-5933
Stoploss-5009
Targets-8987
RT for max reach
#solarindustries #StocksToBuy #stocks #StocksToTrade #StocksInFocus #stockstowatch #StocksInNews


Will It be Double Top or H & S patternCaution ahead on weekly chart Already formed rounding top, made one more peak at higher price suggesting head of "H&S " pattern.
Lets wait and watch for few more weeks to get confirmation.
