STAR trade ideas


STAR - Could be a good mover Strides Pharma has been consolidating in a range for the past 6 months.
This week stock bounced from the support it created previously and closed well.
Now if it sustains 740 levels them it could move towards 930 and 1000 in the near term and also go beyond it.

STAR, Inverted hammer.Inverted hammer after downtrend.
Above to break bearish trend line.
Trend reversal candles.
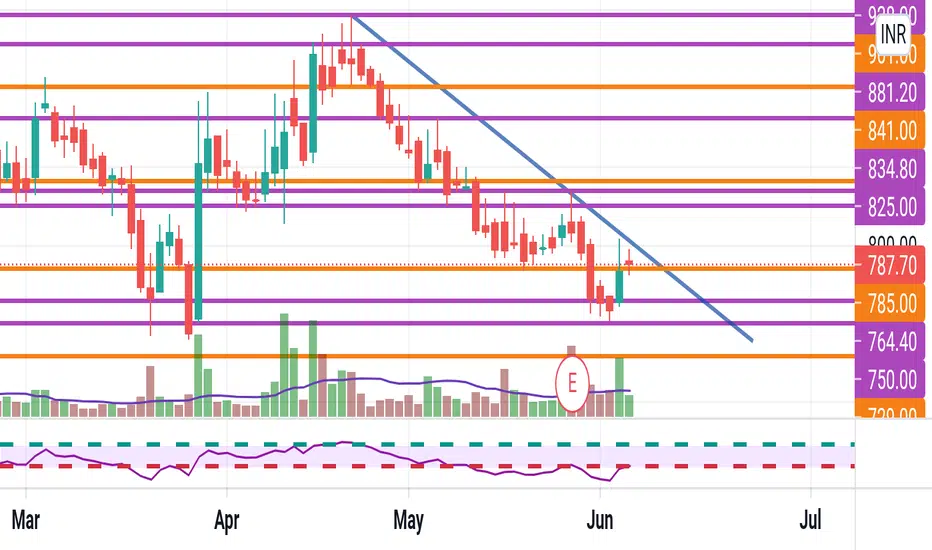


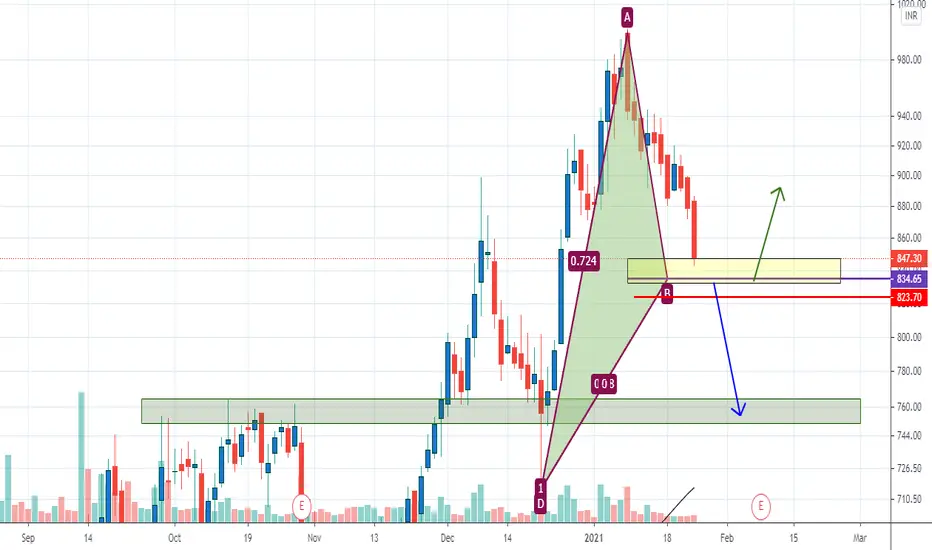
Can this find support here look for reversal pattern in the bullish zone.. if u find go long with SL 823..

Buy #STAR on dips till 770 for medium to long term horizonAccumulate #STAR on dips till 700 with S.L of 752 on CLBS for the target of 920, 1011, and 1260++.

Bullish STARSTAR has broken a short term channel and a breakout of 700 level as well, sustaining above 700 level can give rally upto 790 levels.


STRIDES PHARMAChart is self explanatory.
Breakout happened from the Cup and Handle Pattern but faces a resistance.
Keep a stop loss based on your risk appetite.
*****
Help Me to Help Us.
I believe in keeping the chart simple with minimal drawings & easy to interpret.
So kindly express any disagreement & improvements so that we learn & earn together.
Please support the effort and appreciate it with a Like if you felt it deserves it and Following me would only add on to the motivation.


STAR retested previous supportStrides Pharma has re-tested 550 level and took support at same level on daily basis, which was acted as a resistance for a quite long period. it is continuing it's long term uptrend. it can rally upto 670 followed by 700 levels.


R-0043 Intraday Cash Buy STAR @429.00-431 SL 417.20 TGT 456TK crossover at 417 followed by huge volume so buy on short term

star 16th june 2020my tgt
STAR buy above 402 tgt-404/405/407/408/410...414 sell below 399 .20 tgt-367/395/393...390
Please do ur own analysis before trade.
This is only for education purpose.

Broke Resistance Trendlyne Zone, but closed below 200DMASTAR Broke Resistance Trendlyne Zone, but closed below 200DMA on 15Min chart

Triangle Breakout in STARSTAR is ready for Triangle breakout on 1 hour chart, has a support at 487 level. have been posting good quarterly results for last two quarters. if it breaks lower side next support is at 468 followed by 435. if it breaks upside 550 will be the target. This stock is making higher high's on daily chart.

StridesPharma Cycle bottom made.It's quarterly growth was phenomenal and with news coming to invest in US companies coming up.


