SUDARSCHEM trade ideas

SUDARSHAN CHEMICAL INDS LTD S/RSupport and Resistance Levels:
Support Levels: These are price points (green line/shade) where a downward trend may be halted due to a concentration of buying interest. Imagine them as a safety net where buyers step in, preventing further decline.
Resistance Levels: Conversely, resistance levels (red line/shade) are where upward trends might stall due to increased selling interest. They act like a ceiling where sellers come in to push prices down.
Breakouts:
Bullish Breakout: When the price moves above resistance, it often indicates strong buying interest and the potential for a continued uptrend. Traders may view this as a signal to buy or hold.
Bearish Breakout: When the price falls below support, it can signal strong selling interest and the potential for a continued downtrend. Traders might see this as a cue to sell or avoid buying.
MA Ribbon (EMA 20, EMA 50, EMA 100, EMA 200) :
Above EMA: If the stock price is above the EMA, it suggests a potential uptrend or bullish momentum.
Below EMA: If the stock price is below the EMA, it indicates a potential downtrend or bearish momentum.
Trendline: A trendline is a straight line drawn on a chart to represent the general direction of a data point set.
Uptrend Line: Drawn by connecting the lows in an upward trend. Indicates that the price is moving higher over time. Acts as a support level, where prices tend to bounce upward.
Downtrend Line: Drawn by connecting the highs in a downward trend. Indicates that the price is moving lower over time. It acts as a resistance level, where prices tend to drop.
Disclaimer:
I am not SEBI registered. The information provided here is for learning purposes only and should not be interpreted as financial advice. Consider the broader market context and consult with a qualified financial advisor before making investment decisions.

Sudarshan Chemical Industries📊 Chart Highlights:
Current Price: ₹1,023
Fibonacci Resistance: Price is approaching the 0.618 Fib level at ₹1,027.60, which is a key resistance.
Box Range: Trading within a consolidation box (approx. ₹940–₹1,030) — currently testing the upper end of the range.
Volume: Volume is moderate; not a strong breakout candle yet.
RSI: Trending upwards, nearing overbought (above 60), positive momentum.
Heikin Ashi Candles: Showing bullish strength.
✅ Recommendation: BUY (on confirmation)
📌 Buy Entry:
Buy above ₹1,035 only on breakout confirmation with volume (i.e., daily close above ₹1,035).
🎯 Targets:
Target 1: ₹1,090 (Fib 0.786 level)
Target 2: ₹1,170 (Fib 1.0 level)
Target 3: ₹1,270 (Fib 1.272 extension)
❌ Stop Loss:
Place SL around ₹980 (just below the Fib 0.5 level and EMA cluster)
⚠️ If Rejected at ₹1,030:
Consider range trading: Sell near ₹1,030 with target ₹940–₹950 and SL ₹1,040.
Wait for a clean breakout or breakdown before taking large positions.

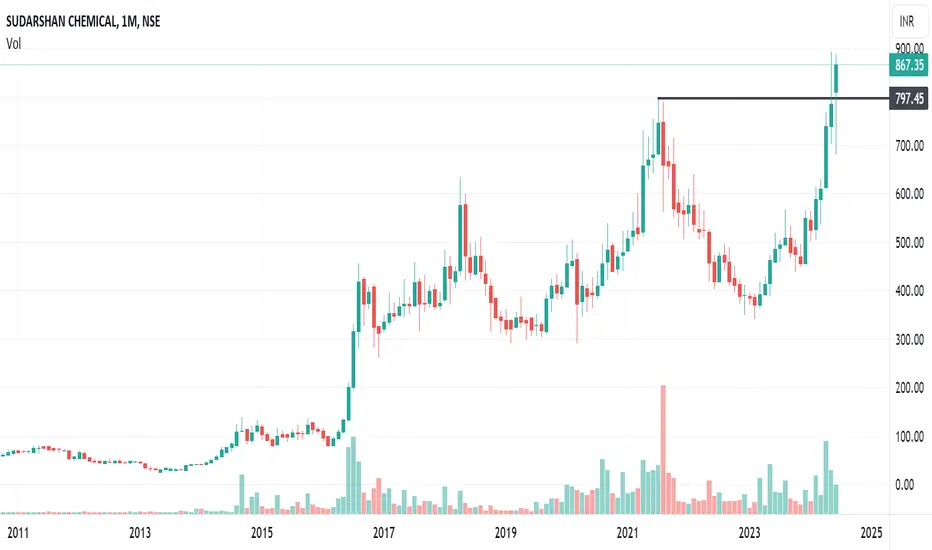
Sudarshan Chemical monthly chart analysisSudarshan chemical chart analysis on monthly time frame. Give your valuable feedback. Please follow if you like.
SUDARSCHEM - Swing Long#Educational purpose only
Take long entry once closes above 766.5 stoploss 707.75
#Follow strict stoploss


SUDARSCHEM looks goodSUDARSCHEM looks good,made pyara setup.
Sl 607 ke sath...Up target mast hai.
This is only for educational purpose.

Superb stoploss and gain ratioPerfect stairs uptrend after rounding bottom. Please also check fundamental as well as technical by yourself & comment your views.

SUDARSCHEMSUDARSCHEM
All targets mentioned
***I am not SEBI Registered. All my charts and analyses are only for educational purposes not for trading purposes

💥Sudarshan Chemicals💥-Nice Breakout💥Sudarshan Chemicals💥-Nice Breakout
Capital to be deployed- 20k
Investing Price-549-552
Breakout Price-549
Stoploss-442
Targets-712-926
RT for max reach
#sudarshanchemicals #stockstowatch #StocksToBuy #StocksInFocus #stocks #StockMarket

Stock crossing the 200 SMA and also closing above its resistance
After an proper correction in stock, is ready for another upward rally. Stock has closed adove 200 SMA and its resistance which is around 505. As per the Fibonacci relationship method the upcoming targets can be equal to 1 or 1.68 times of first wave. Nice level to have a stock in portfolio.

Technical investment idea of the week - Sudarshan chemicalsStock price is consolidating. Stock price was regularly making lower highs and lower lows, Weekly closing above 525 will confirm the first higher high and higher low which is a confirmation of trend reversal. Immediate hurdle is at 525 followed by 545. Weekly closing above 545 will also give a breakout from inverse head and shoulder pattern neckline and it will open up levels of 615, 650 and 765.

Sudarshan ChemicalSudarshan Chemical
Add in Watchlist
Can Buy near 460-465
Sl -447
Target- 490/515/540
Analysis on 30/09/23
Double Bottom Formation/M

Can Sudarshan Chemical be able to give breakout ?In weekly chart of Sudarshan Chemical, Head and Shoulder chart pattern is in making and the break out point is above 520 level .
If the breakout happen the target would be 620, 680 respectively.

Sudarshan Chemicals looking to rotate and shineSudarshan Chemicals Industries Ltd is a global supplier of high-end pigments with a diverse range of products ranging from organic, inorganic and effect pigments to performance colorants, pearlescent pigments and speciality chemicals. Products of the company mainly use in Art and craft, paper, agriculture and textile.
Sudarshan Chemicals Industries Ltd CMP is 487.10. Negative aspects of the company are high valuation ( P.E. = 75.3), declining annual net profits, MFs are decreasing stake. Positive aspects of the company are low debt, improving cash from operations annuals, FIIs are increasing stake, zero promoter pledge.
Entry can be taken after closing above 498. Targets in the stock will be 520 and 542. Long term target in the stock will be 579. Stop loss in the stock should be maintained at closing below 458.

SUDARSCHEMSUDARSCHEM for long term Investment, entry in green zone only, seems good for Long from here.. Target, SL clearly given in chart
***I am not SEBI Registered. All my charts and analysis are only for educational purpose not for trading purpose.

Sudarshan Chemicals - Breakout!!!Go long!!! Major breakout in Sudarshan Chemicals....technical suggesting bottomed out complete....


SUDARSCHEM going to give beautiful breakout and upmoveDownside rally has been in a weak price fashion, now upside might be seen.

Sudarshan Chemical Heading for 720-760+Sudarshan Chemical setting up nicely, keep on radar for short to med-term. Looks like It's Heading for 720-760+
Consult your financial advisor before investing...

SUDARSHAN CHEMICALS :: BULLISHDATE: 3 FEB 2022
INSTRUMENT: SUDARSHANCHEM
TREND: BUY
TYPE: SHORT TERM
TIME FRAME: DAY
CMP: 630
BUY ABOVE: 636
STOP LOSS: 588
TGT 01: 680
RISK DISCLOSURE:
We are not S E B I registered analysts. VIEWS EXPRESSED HERE ARE FOR OUR RECORD PURPOSES ONLY. Please consult your personal financial advisor before investing. We are not responsible for your profits/losses whatsoever.

SUDARSCHIM Levels 31.12.2021 (D Candle)SUDARSCHIM try to break trend line ,once its break it will see 650+ in 2022

