Sundaram Finance - Cup Pattern breakoutSundaram Finance Holdings Ltd.
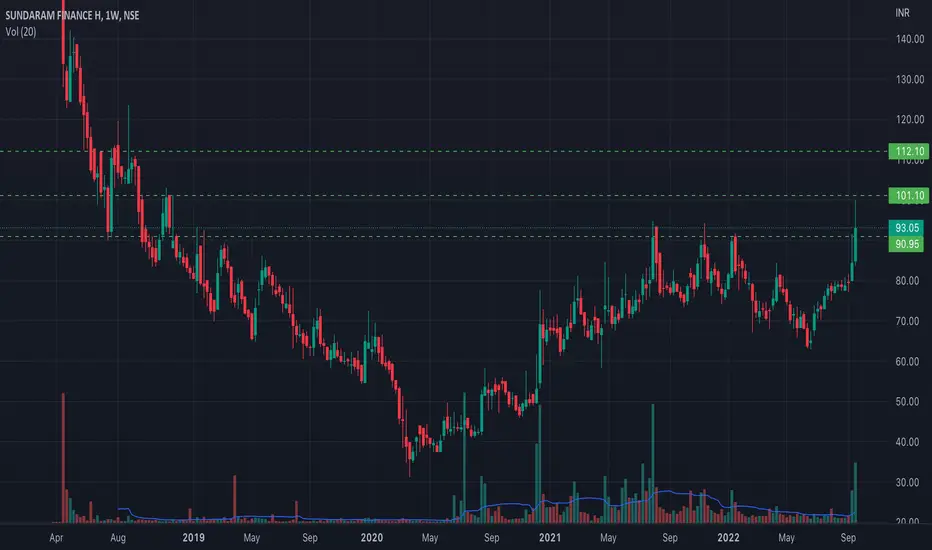
CUP pattern breakout on WEEKLY timeframe.
Multiyear High.
High Trade and Delivery Quantity this week.
Close within 52 week zone.
Disclaimer:
For educational purpose only.
Please do your own research before taking any trades.
Happy Trading!
SUNDARMHLD trade ideas

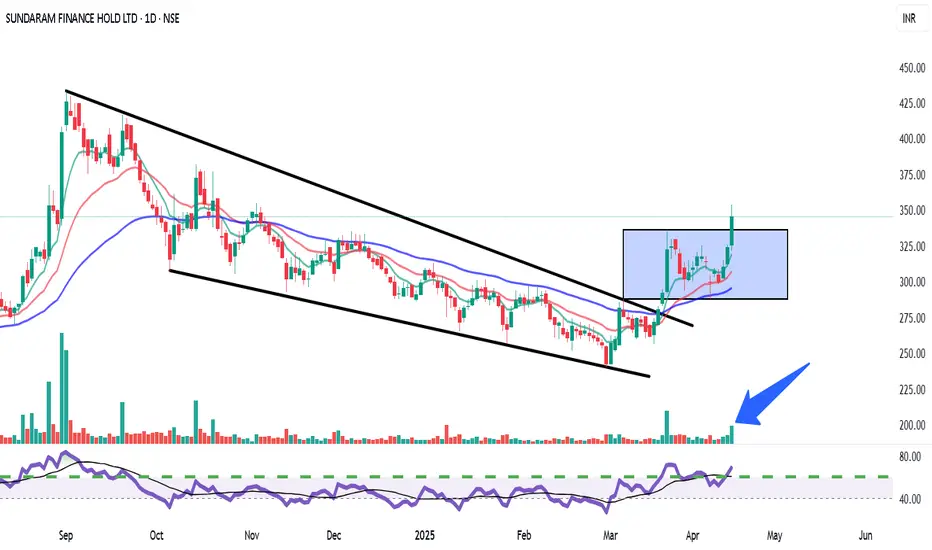
Sundaram Finance | Falling Wedge Breakout with Strong Volume Pattern: Falling Wedge breakout followed by consolidation (bullish continuation).
Breakout Confirmation: Clean breakout from both the wedge and the consolidation box with strong volume.
Indicators:
Volume: Spike visible (🔵 arrow) – confirming strength.
RSI: Crossed above 60 – entering bullish momentum territory.
EMAs: Price trading above all major EMAs – trend supportive.
Buy Recommendation:
Entry Range: ₹340–₹350
(Post-breakout retest may offer ideal entries if available)
🎯 Target Levels:
Short-Term Target: ₹375
Mid-Term Target: ₹410–₹425
(Based on previous swing highs and wedge height projection)
🛑 Stop Loss:
SL Level: ₹320 (below the consolidation box low)
for educational purposes only
SUNDARMHLD 330 is buy good level SUNDARMHLD 330 is buy good level
Is good BTST Good
Weekly Breakout
level Study and buy
only for
Education purpose

Sundaram finance Holding IPO BasedIPO Based Strategy
Darvas boxes are a fairly simple indicator created by drawing a line along lows and highs. As you update the highs and lows over time, you will see rising boxes or falling boxes. Darvas box theory suggests only trading rising boxes and using the highs of the boxes that are breached to update the stop-loss orders.

5 Year Long Breakout in SUNDARMHLDA 5 year breakout in Sundaram Finance holding. Daily chart has too many gaps because of the continuous gap downs, Weekly chart shows good momentum is due and ahead in this stock.
Buy around 135 and hold with your own Risk, Round bottom target for me and 175 in short term.

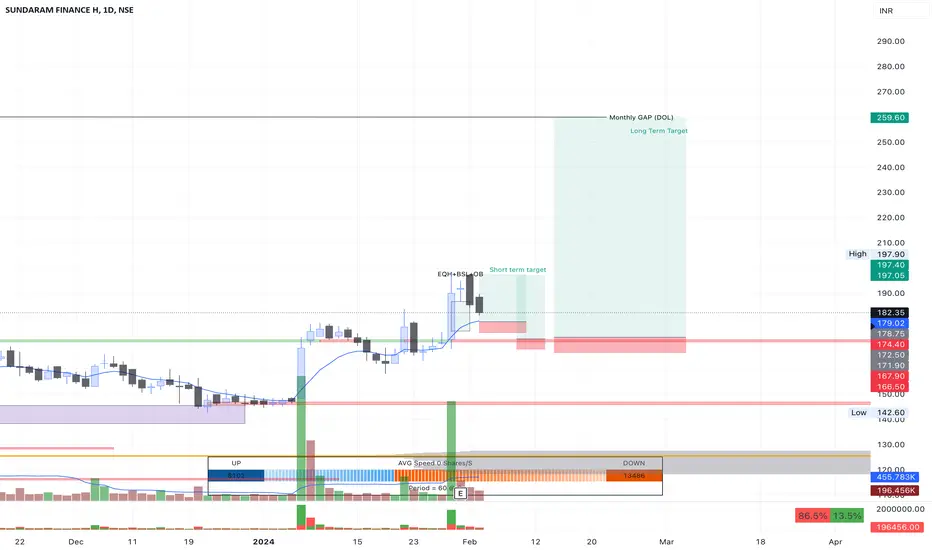
SUNDARMHLD BUYOver here we can see price is reverting bac into fair value gap near its support areas. I have positioned two possible point of interest entries on the chart for everyone to consider. In the short term, we will be targeting the order block on the sell side. If you are a longer term investor and can manage your risk well while holding then I have attached the longer term 50% target also. The company posted good QoQ report, and it is important to know that price action near earnings is usually false. This creates a good chance to enter at a cheaper price. The view is invalid if it closes marginally below the resistance level. No buy sell reco NSE:SUNDARMHLD
Sundaram Finance : Bullish "N"
Bullish N shape has formed on weekly chart.
Volume is supporting the trend
These days finance stocks are in bullish trend.
Typical copy book rounding pattern is visible on monthly chart
TARGET : 200
STOP LOSS: 150
**These are my personal observations. Please trade at your own risk.**

SUNDARAM FINANCE, Possibility of pullback @143, upward potentialLooking good on weekly and monthly chart, Possibility of pullback @143, then ready for up move up to Rs. 170
*Only for Educational purpose, no recommendation for Buy or Sell

SUNDARAM FINANCE 1w time frame buy @ 126 target @140.75, 143, SUNDARAM FINANCE 1w time frame
buy @ 126 target @140.75, 143, 146.50
ascending channel breakout
risk reward 1.4
its just a view trade @ your own risk
sl@110.50

Today stockUptrend moment in stock
Volume and breakout chart
Global and our market at bulish
This stock bulish
No recommendation for buy and sell
Take own analysis

SUNDARMHLD DAILY CHARTSUNDARMHLD DAILY CHART
Breakout @ 107.50 Target 127 Support 99
SUNDARMHLD has witnessed a breakout @ 107.50 levels, Target projected @ 127 levels.

Sundaram Finance-Nice BreakoutSundaram Finance-Nice Breakout
Capital to be deployed- 20k
Investing Price -118-121
Breakout Price -118
Stoploss -97
Targets -160-206-310
Do retweet so that it helps someone
#sundaram #StocksInFocus #StocksToBuy #stockstowatch #StocksInNews #SwingTrading #BREAKOUTSTOCKS

SUNDARMHLD Weekly chart - Bullish momentumGood volume
Looking good on weekly chart
Bullish momentum
*Not recommendation
#SUNDARMHLD #SUNDARMFIN #FINTECH #FINANCE #TECH #Iot #ML #AI #ITSundaram Finance Holdings Ltd.
NSE:SUNDARMHLD
NSE: SUNDARMHLD
CMP: 83.65
Target 1: 96+
Target 2: 110+
Time frame: <6months
Factors:
BULLISH WEDGE BREAKOUT
Trend Following
Rising Volume with rising Prices.
Flag pattern breakout.
Pennant Pattern Breakout with Bullish Candle.
Retest Successful.
Higher Highs & Higher Lows.
Broken above RESISTANCE levels
Trading at SUPPORT levels
Earnings are strong.
Bullish Wedge Breakout
Risk Return Ratio is healthy.
And
Rising from Double Bottom Pattern to Flag Pattern forming.
If you like my work KINDLY LIKE SHARE & FOLLOW this page for free Stock Recommendations.
With 💚 from Rachit Sethia

About to break strong resistance point Go long at 82-85About to break strong resistance point
Go long at 82-85 for target gains of 7-8 %


Sundaram finance holdings buyCMP 70.50
TECHNICAls buy based on
Harmonics / Fibonacci / demand zone /multiple Support
Buy and accumulate till 66
Keep stoploss as 60 on weekly basis
TARGETS 🎯
73/78/83/88/91++

