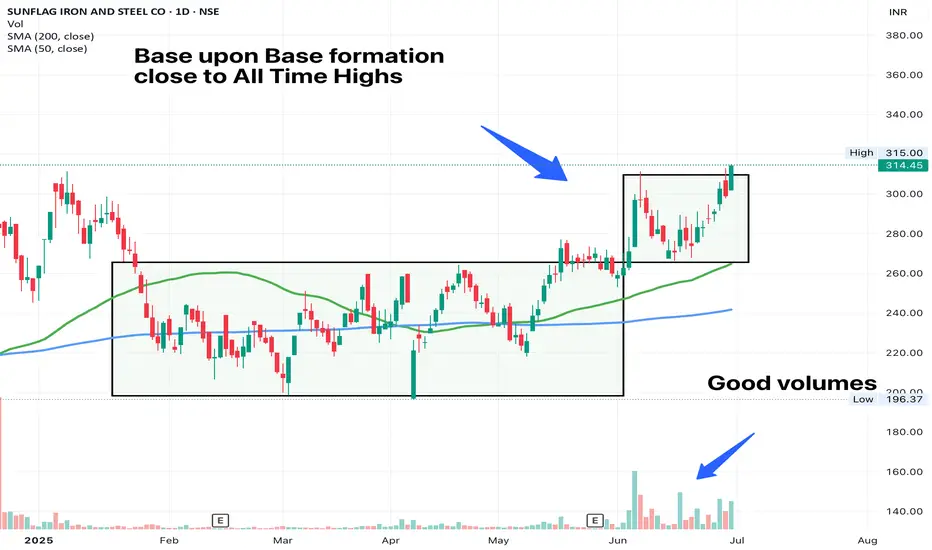
SUNFLAG - Base on Base FormationAnother set-up in the metals space. After Welcorp, LloydSME and APLApollo, this could be another favourable trade. The stock is attempting to breakout of the base today. Volumes have been good and the trend is already in place. Our job as a trader is to sit tight on structures till the trend lasts.
SUNFLAG trade ideas
SUNFLAGNSE:SUNFLAG
Note :
1. One should go long with a Stop Loss, below the Trendline or the Previous Swing Low.
2. Risk :Reward ratio should be minimum 1:2.
3. Plan your trade as per the Money Mangement and Risk Appetite.
Disclamier : You are responsible for your profits and loss.
The idea shared here is purely for Educational purpose.
Follow back, for more ideas and their notifications on your email.
Support and Like incase the idea works for you.

SUNFLAG IRON AND STEEL CO. S/RSupport and Resistance Levels:
Support Levels: These are price points (green line/shade) where a downward trend may be halted due to a concentration of buying interest. Imagine them as a safety net where buyers step in, preventing further decline.
Resistance Levels: Conversely, resistance levels (red line/shade) are where upward trends might stall due to increased selling interest. They act like a ceiling where sellers come in to push prices down.
Breakouts:
Bullish Breakout: When the price moves above resistance, it often indicates strong buying interest and the potential for a continued uptrend. Traders may view this as a signal to buy or hold.
Bearish Breakout: When the price falls below support, it can signal strong selling interest and the potential for a continued downtrend. Traders might see this as a cue to sell or avoid buying.
MA Ribbon (EMA 20, EMA 50, EMA 100, EMA 200) :
Above EMA: If the stock price is above the EMA, it suggests a potential uptrend or bullish momentum.
Below EMA: If the stock price is below the EMA, it indicates a potential downtrend or bearish momentum.
Trendline: A trendline is a straight line drawn on a chart to represent the general direction of a data point set.
Uptrend Line: Drawn by connecting the lows in an upward trend. Indicates that the price is moving higher over time. Acts as a support level, where prices tend to bounce upward.
Downtrend Line: Drawn by connecting the highs in a downward trend. Indicates that the price is moving lower over time. It acts as a resistance level, where prices tend to drop.
Disclaimer:
I am not a SEBI registered. The information provided here is for learning purposes only and should not be interpreted as financial advice. Consider the broader market context and consult with a qualified financial advisor before making investment decisions.

Can Hold For 3 month This Stock is Extremely in Uptrend.
It is Again given break out so Can Take it .

Sunflag iron & steel trading ideaStock breakout its pennant pattern on the weekly chart also showing a gap up opening on the day chart with very good trade volume although i have created a blog on this stock yesterday but forgot to to post here. now you can see the chart level as i draw
if i talk about the technical part so clearly we can see a channel pattern breakout stock trade on all ema
Educational Content
This stock analysis is designed for educational purposes and should not be taken as professional financial advice. Please carry out your own research or consult with a financial advisor before investing.

SUNFLAG TRIANGLE BREAKOUT
After consolidating for nearly a year, Sunflag has recently broken out of a triangle pattern with an average-sized candle. A strong weekly close would be a positive signal to consider entering the trade, with a recommended stop loss set between 10-12% below the entry point.

SUNFLAG IRON & STE SWING TRADE IDEASUNFLAG IRON & STE looking gud for swing trade as per price action very much near to break its weekly resistance zone few days ago broke inverted head and shoulders chart patterns neck line with gud volume and retested that neck line can look for swing as per your prefered RR.

SunflagLooks very good once the candle closes above 208 where it retested the long term trendline after it broke out a couple of months ago
Chart structure looks good in almost all the time frames
SL below 200

SUNFLAGThese are swing ideas which you can add your watchlist and analysis for yourself !
Keep on your radar!
This content only education purpose!
❗I am not sebi ragister❗

Low risk entryFollow mark level
Breakout trading implementation:
1. **Identifying New Trends:** Breakout trading helps traders identify the beginning of new trends by focusing on price levels where an asset breaks out of its historical trading range.
2. **Volatility Indicator:** Breakouts often occur when there's increased volatility in the market. Monitoring breakouts can provide insights into shifts in market sentiment and potential price movements.
3. **Entry Points:** Breakout points serve as potential entry points for traders looking to ride the momentum of a newly established trend. Buying on a breakout can capture the early stages of a price movement.
4. **Confirmation of Strength:** Successful breakouts indicate the strength of a trend. If an asset breaks out with high volume and follows through with sustained price movement, it suggests a strong trend in that direction.
5. **Avoiding False Signals:** Breakout strategies often include using indicators or confirmation signals to avoid false breakouts. This can enhance the accuracy of trade decisions.
6. **Defined Risk and Reward:** Breakout trading allows for setting clear stop-loss levels below the breakout point, which helps manage risk. Traders can also calculate potential profits based on the distance between the breakout point and a projected target.
7. **Adaptable to Various Markets:** Breakout trading can be applied to various markets, including stocks, forex, commodities, and cryptocurrencies. The concept remains consistent across different assets.
8. **Flexibility:** Traders can adapt breakout strategies to their preferred timeframes, whether they are day traders, swing traders, or long-term investors.
9. **Liquidity Opportunities:** Breakout points are often associated with increased trading volume, which can provide better liquidity for executing trades.
10. **Risk vs. Reward Assessment:** Traders can evaluate the potential risk of a trade (stop-loss) against the potential reward (target price), aiding in decision-making and portfolio management.
11. **Psychological Advantage:** Successful breakout trades can boost a trader's confidence and discipline, reinforcing the effectiveness of their strategy.
12. **Market Events:** Breakouts can occur around significant market events such as earnings reports, economic data releases, or geopolitical developments, offering traders opportunities to capitalize on sudden price movements.
Remember, while breakout trading offers potential advantages, it also carries risks. False breakouts and market reversals can lead to losses. Successful implementation requires a solid understanding of technical analysis, risk management, and the ability to adapt to changing market conditions.

Trendline Resistance BreakoutPlease look into the chart for a detailed understanding.
Consider these for short-term & swing trades with 2% profit.
For BTST trades consider booking
target for 1% - 2%
For long-term trades look out for resistance drawn above closing.
Please consider these ideas for educational purpose

SunflagBuy Above:- 173
Stop loss:- 151
Target :- 195
Time:- 45 Trading days
Sunflag group which has diversifed business interests in steel, synthetic yarn fabrics spanning across the globe

Channel BreakoutPlease look into the chart for a detailed understanding.
Consider these for short-term & swing trades with 2% profit.
For BTST trades consider booking
target for 1% - 2%
For long-term trades look out for resistance drawn above closing.
Please consider these ideas for educational purpose

Long Sunflag🛡SUNFLAG
💠Stock Trading above 50 & 200 EMA
💠Stock making Big Base with higher volume
💠 Stock structure is Uptrend
💠 Breakout Level 152 Support 144
💠 RR Favorable for going long
♻️ Retweet for max reach

Multibagger short term Multibagger Stock , from current levels high Volumes
Targets short term as shown

channel for informative and educational purpose onlychannel for informative and educational purpose only

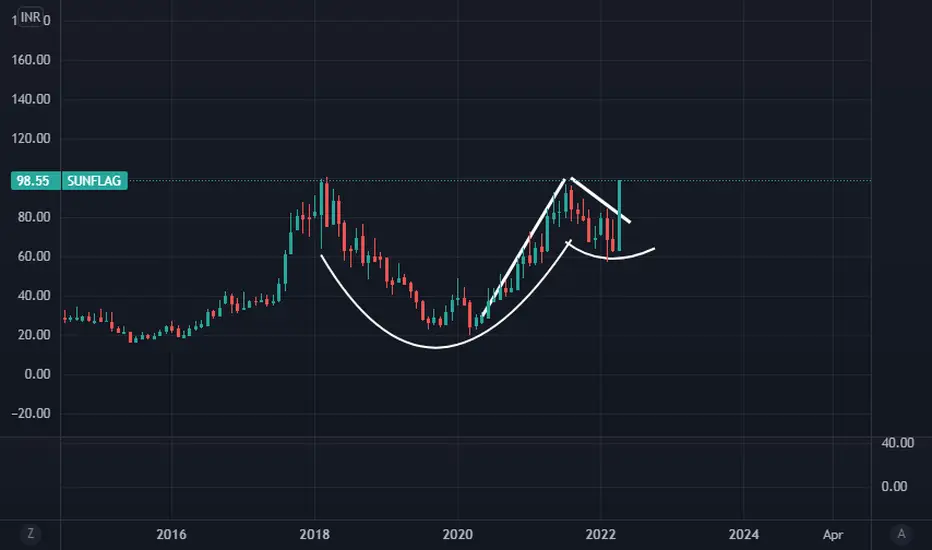
sunflag 5 year breakout? cup and handle formation on monthly chart
flag breakout on monthly chart
wait for breakout and retest.
P/E 7 , intrinsic value 197
for education purposes only.
Okay. SUNFLAG at it's important level now!Sunflag as its important level on its bullish trend line as well as Fibonacci level. There are two possibilities from here that we will be based on the Earning results coming on 16 November.
Start buying now and do averaging in coming weeks.

sunflag cup patternEntry 95 to 98
stock is above 50 MA and 200 MA
in camirila , in Day schart stock is in S2 level . R4 is above 100 . once it crosses 100 . can have entry
In camrilla weekly chart , it crossed R4 .

SUNFLAG LONG 1D TimeframeThis can be a good trade for swing/positional both.
CMP at 93.30 looks good for more upside. Targets 100-110-120.
With the increase in good volumes and earnings around the corner this looks potential enough.
#Doitatyouownrisk


