buying zone Look for areas where the price has stalled or reversed: Supply and demand zones occur where there has been a concentration of buying or selling pressure, causing the price to stall or reverse. Look for areas on the chart where the price has struggled to move higher or lower, indicating potential supply or demand zones
SUNTV trade ideas
SUNTV Trend directionSUNTV 629 has shown weakness. We expect It to hit the resistance 639 and to drop down to support 529

Suntv Daily & 1Hr TFits have been trading inside a parallel channel. after the good upside momentum it has corrected steadily and has taken support on the support trendline. looking good for a long trade with 610 or 600 as support with respect to the TF.
place the targets according to the TFs

Sun Tv bulish bat pattern Sun Tv bulish bat pattern cmp 631 on 09.02.2025 if form bulish candle in this zone it can easily complate the all target ... will see..

SunSUN tv possibilities of correction pattern. most probably the down leg is down now for a pull back to fall again to continue correction until impulse move is seen on the rise. protecting capital and the first target for any trade to be successful. probability is just shown on the chart

SUNTV : Reversal from Golden Retracement Zone SUN TV Network
Wave Analysis:
Prices have corrected to the golden retracement zone (712-698 INR), a strong potential reversal area.
The stock recently saw a CHOCH (Change of Character) near 768 INR, indicating bearish rejection at higher levels.
Key Observations:
Liquidity Zone: Prior liquidity was swept between 712-698 INR, signaling accumulation.
Active Buy Zone: 719-735 INR remains a key accumulation area for buyers.
Trading Plan:
Entry:
Primary entry between 719-735 INR.
Secondary entry near 712 INR for deeper retracement.
Stop-Loss: Place stop-loss below 690 INR.
Target Levels:
First target: 830 INR (minor resistance).
Final target: 871-894 INR (completion of Wave C correction).
Indicators to Monitor:
Watch for bullish price action near 719-735 INR.
ChOCH breakout for early entry signals.
Disclaimer: This analysis is for educational purposes only. I am not a SEBI-registered analyst. Please do your own research or consult a financial advisor before trading.

#SUNTVSUNTV has just broken out of a Bullish Flag and Pole Pattern on DTF. Probable targets marked in a 3month to 6month time frame is good.

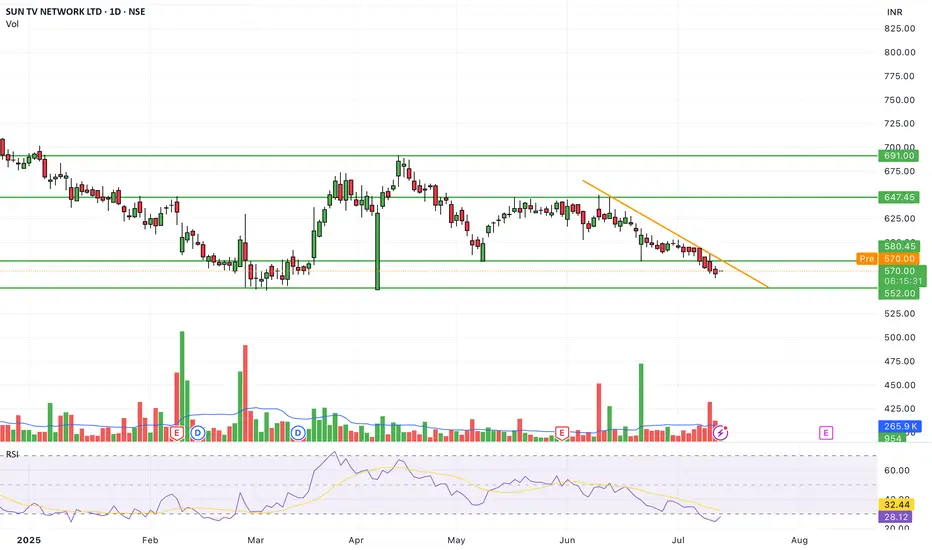
SUN TV NETWORK LTD S/R Support and Resistance Levels:
Support Levels: These are price points (green line/shade) where a downward trend may be halted due to a concentration of buying interest. Imagine them as a safety net where buyers step in, preventing further decline.
Resistance Levels: Conversely, resistance levels (red line/shade) are where upward trends might stall due to increased selling interest. They act like a ceiling where sellers come in to push prices down.
Breakouts:
Bullish Breakout: When the price moves above resistance, it often indicates strong buying interest and the potential for a continued uptrend. Traders may view this as a signal to buy or hold.
Bearish Breakout: When the price falls below support, it can signal strong selling interest and the potential for a continued downtrend. Traders might see this as a cue to sell or avoid buying.
20 EMA (Exponential Moving Average):
Above 20 EMA(50 EMA): If the stock price is above the 20 EMA, it suggests a potential uptrend or bullish momentum.
Below 20 EMA: If the stock price is below the 20 EMA, it indicates a potential downtrend or bearish momentum.
Trendline: A trendline is a straight line drawn on a chart to represent the general direction of a data point set.
Uptrend Line: Drawn by connecting the lows in an upward trend. Indicates that the price is moving higher over time. Acts as a support level, where prices tend to bounce upward.
Downtrend Line: Drawn by connecting the highs in a downward trend. Indicates that the price is moving lower over time. It acts as a resistance level, where prices tend to drop.
RSI: RSI readings greater than the 70 level are overbought territory, and RSI readings lower than the 30 level are considered oversold territory.
Combining RSI with Support and Resistance:
Support Level: This is a price level where a stock tends to find buying interest, preventing it from falling further. If RSI is showing an oversold condition (below 30) and the price is near or at a strong support level, it could be a good buy signal.
Resistance Level: This is a price level where a stock tends to find selling interest, preventing it from rising further. If RSI is showing an overbought condition (above 70) and the price is near or at a strong resistance level, it could be a signal to sell or short the asset.
Disclaimer:
I am not a SEBI registered. The information provided here is for learning purposes only and should not be interpreted as financial advice. Consider the broader market context and consult with a qualified financial advisor before making investment decisions.

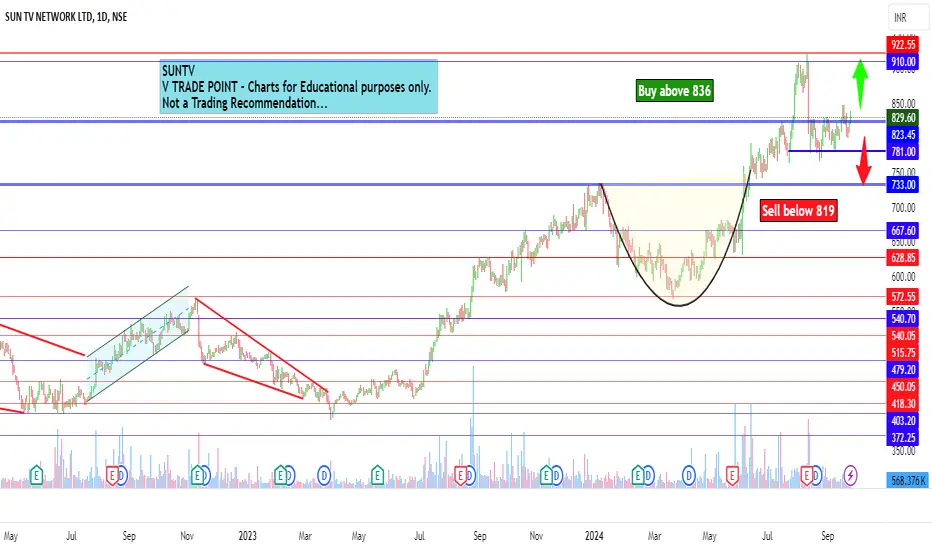
SUN TV Network Ltd view for Intraday 25th September #SUNTV SUN TV Network Ltd view for Intraday 25th September #SUNTV
Buying may witness above 836
Support area 824-825. Below ignoring buying momentum for intraday
Selling may witness below 819
Resistance area 824-825
Above ignoring selling momentum for intraday
Charts for Educational purposes only.
Please follow strict stop loss and risk reward if you follow the level.
Thanks,
V Trade Point
SUN TV HAS BROKEN THE RESISTANCE!Please remember the following information:
SUN TV has broken the resistance level of 829 on an hourly timeframe.
Entry: 829-833
Stop Loss: 815
Target Range: 860-865
Important Note: Sun TV Network's consolidated net profit for the quarter ended June has dropped by 6% to Rs 546 crore due to a decrease in revenue and an increase in expenses. EBITDA for the quarter was up by 10% to Rs 706 crore. Therefore, be cautious if you are considering buying the stock or taking a long position.

SUNTV Flag Pattern (daily chart)Need to cross recent high 908
RSI Above 60 Daily / Weekly / Monthly
EMA in line
Volume Growth
Entry 899
SL 865
Expected Level 1097.80 only 21% upside

SUNTV on the Move: Bullish Breakout with Strong Volume Support
Breakout Alert: Bullish breakout confirmed
Trend: Strong uptrend with increasing momentum
Volume: Supported by strong volume, indicating buyer interest
Action: It's time to join the ride!

SUN TV NETWORK LTD S/RSupport and Resistance Levels:
Support Levels: These are price points (green line/share) where a downward trend may be halted due to a concentration of buying interest. Imagine them as a safety net where buyers step in, preventing further decline.
Resistance Levels: Conversely, resistance levels (red line/shade) are where upward trends might stall due to increased selling interest. They act like a ceiling where sellers come in to push prices down.
Breakouts:
Bullish Breakout: When the price moves above resistance, it often indicates strong buying interest and the potential for a continued uptrend. Traders may view this as a signal to buy or hold.
Bearish Breakout: When the price falls below support, it can signal strong selling interest and the potential for a continued downtrend. Traders might see this as a cue to sell or avoid buying.
20 EMA (Exponential Moving Average):
Above 20 EMA: If the stock price is above the 20 EMA, it suggests a potential uptrend or bullish momentum.
Below 20 EMA: If the stock price is below the 20 EMA, it indicates a potential downtrend or bearish momentum.
Disclaimer:
I am not a SEBI registered. The information provided here is for learning purposes only and should not be interpreted as financial advice. It's important to remember that while these indicators can be useful, they are not foolproof. Always consider the broader market context and consult with a qualified financial advisor before making any investment decisions.

Sun TV Network Ltd intraday level for 6th Aug #SUNTV Sun TV Network Ltd intraday level for 6th Aug #SUNTV
Buying may witness above 891
Support area 880. Below ignoring buying momentum for intraday
Charts for Educational purposes only.
Please follow strict stop loss and risk reward if you follow the level.
Thanks,
V Trade Point

RR is favourable.please look time frame first and then choose your RR
if satisfice with that then only.
All the best.
Gratify if you appreciate the practice then you can like it, share it and
If you want me to investigate any chart for you then would cherish doing that for you.
Thank you for your time and support.
Stay safe.

Sun TV Network Ltd Intraday level for 31st July #SUNTV Sun TV Network Ltd Intraday level for 31st July #SUNTV
Buying may witness above 883
Support area 872-875. Below ignoring buying momentum for intraday
Charts for Educational purposes only.
Please follow strict stop loss and risk reward if you follow the level.
Thanks,
V Trade Point

Sun TV Network Ltd Intraday level for 29th July #SUNTV Sun TV Network Ltd Intraday level for 29th July #SUNTV
Buying may witness above 834
Support area 825. Below ignoring buying momentum for intraday
Charts for Educational purposes only.
Please follow strict stop loss and risk reward if you follow the level.
Thanks,
V Trade Point


Sun TV Network Ltd Intraday level for 26th July #SUNTV Sun TV Network Ltd Intraday level for 26th July #SUNTV
Buying may witness above 823
Support area 810-815. Below ignoring buying momentum for intraday
Charts for Educational purposes only.
Please follow strict stop loss and risk reward if you follow the level.
Thanks,
V Trade Point

Sun TV Network Ltd Intraday level for 25th July #SUNTV Sun TV Network Ltd Intraday level for 25th July #SUNTV
Buying may witness above 811
Support area 800. Below ignoring buying momentum for intraday
Selling may witness below 799
Resistance area 810-811. Above ignoring selling momentum for intraday
Charts for Educational purposes only.
Please follow strict stop loss and risk reward if you follow the level.
Thanks,
V Trade Point


Sun TVSun TV making rounding bottom and looks good for the upside movement above 680.
Swing Trading would be preferable for 1-2 month for the target of 730

buythe stock gave a retest breakout from previous swing with good volumes and RSI showing good momentum . we can see proper cup formation in the stock indicating good accumulation prior breakout. good to buy at 735-740 levels for target of 900 in the medium term.
