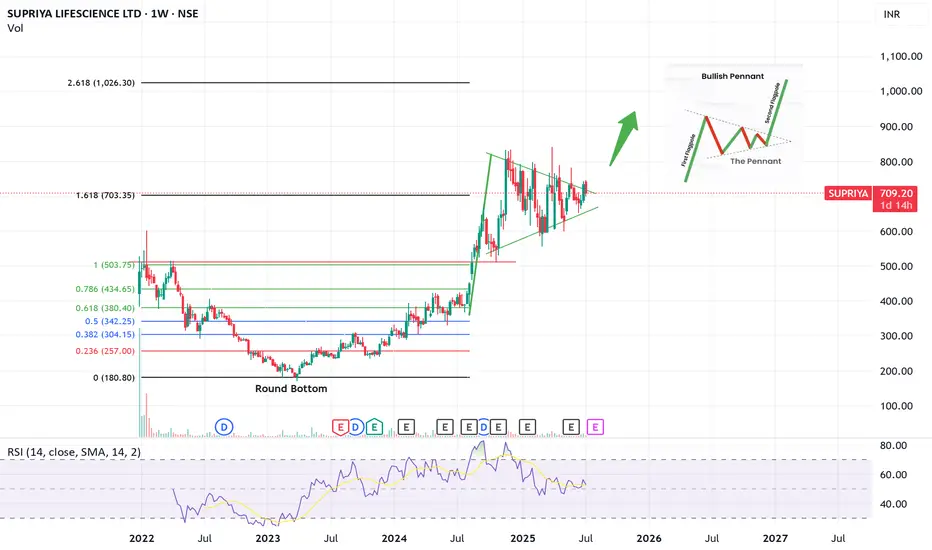
SUPRIYA! Bullish Penant. Weekly- Good company with decent fundamentals
- Bullish Penant visible. Need Breakout confirmation
- A little more consolidation possible
This is not a buy/sell advice. Only for educational purposes
SUPRIYA trade ideas
Supriya life science Cup and handle pattern
Retest Complete at 620 level and sharp recovery from retest.
Further targets are by consolidation period and febino pattern.
This is educational purposes only.

Supriya Life Monthly Chart
CUP Pattern
Retested level
RSI above 60 W / M
Daily RSI above 40
Resistance 792-835

SUPRIYA LIFESCIENCE LTD S/RSupport and Resistance Levels:
Support Levels: These are price points (green line/shade) where a downward trend may be halted due to a concentration of buying interest. Imagine them as a safety net where buyers step in, preventing further decline.
Resistance Levels: Conversely, resistance levels (red line/shade) are where upward trends might stall due to increased selling interest. They act like a ceiling where sellers come in to push prices down.
Breakouts:
Bullish Breakout: When the price moves above resistance, it often indicates strong buying interest and the potential for a continued uptrend. Traders may view this as a signal to buy or hold.
Bearish Breakout: When the price falls below support, it can signal strong selling interest and the potential for a continued downtrend. Traders might see this as a cue to sell or avoid buying.
MA Ribbon (EMA 20, EMA 50, EMA 100, EMA 200) :
Above EMA: If the stock price is above the EMA, it suggests a potential uptrend or bullish momentum.
Below EMA: If the stock price is below the EMA, it indicates a potential downtrend or bearish momentum.
Trendline: A trendline is a straight line drawn on a chart to represent the general direction of a data point set.
Uptrend Line: Drawn by connecting the lows in an upward trend. Indicates that the price is moving higher over time. Acts as a support level, where prices tend to bounce upward.
Downtrend Line: Drawn by connecting the highs in a downward trend. Indicates that the price is moving lower over time. It acts as a resistance level, where prices tend to drop.
Disclaimer:
I am not a SEBI registered. The information provided here is for learning purposes only and should not be interpreted as financial advice. Consider the broader market context and consult with a qualified financial advisor before making investment decisions.
Supriya LifeScience Can Hit 1000 Rs?Supriya LifeScience did a breakout a month before now retesting its previous ath and ready to shoot upto 1000 Rs add in your watchlist.

Supriya Lifescience LtdTarget given in chart - SL as per your appetite
Fundamentals
Market Cap
₹ 5,556 Cr.
Current Price
₹ 690
High / Low
₹ 704 / 243
Stock P/E
35.3
Book Value
₹ 113
Dividend Yield
0.12 %
ROCE
22.2 %
ROE
15.7 %
Face Value
₹ 2.00
Price to book value
6.13
Intrinsic Value
₹ 616
PEG Ratio
1.43
Price to Sales
8.89
Debt
₹ 5.51 Cr.
Debt to equity
0.01
Int Coverage
117
Reserves
₹ 890 Cr.
Promoter holding
68.3 %
Pledged percentage
0.00 %
EPS last year
₹ 14.8
Net CF
₹ -82.6 Cr.
Price to Cash Flow
49.0
Free Cash Flow
₹ -32.4 Cr.
OPM last year
30.9 %
Return on assets
13.7 %
Industry PE
32.1
Sales growth
20.3 %

50 SMA Rising - Swing Tradeisclaimer: I am not a Sebi registered adviser.
This Idea is publish purely for educational purpose only before investing in any stocks please take advise from your financial adviser.
50 SMA Rising strategy. Suitable for Swing Trading Initial Stop loss lowest of last 2 candles and keep trailing with 30 days SMA if price close below 30 SMA then Exit or be in the trade for 2 to 4 weeks.
Target & Stop loss shown on Chart. Do not Forget to Exit if Stop loss Hit.
Be Discipline because discipline is the Key to Success in the STOCK Market.

Supriya lifesciences ltdThe stock has been in an uptrend making HH Hl
The stock is taking support and looks to have ended its 4th wave and started 5th wave of bigger 3rd wave
Safe entry will be above avwap

SUPRIYA CMP 449.Stock near 52 week high and all time high zone. Showing strenth in price.Add to your wachlist and find stoploss and targets.


SUPRIYA - Bullish oNStock name - Supriya Lifescience Limited.
✅#SUPRIYA
✅Next resistance 669.
✅Moved 64% in 27 weeks.
Weekly chart
Chart is self explanatory everything.
Master score - B
Disclaimer : This is for demonstration and education purpose only. This is not buying and selling recommendation. I'm not SEBI registered.

SUPRIYA - Bullish oNStock name - Supriya Lifescience Ltd.
✅#SUPRIYA trading above resistance 1.
✅Next resistance 527.
✅Moved 29% in 26 weeks.
Weekly chart
Chart is self explanatory
Master score - C
Disclamer : This is for demonstration and education purpose only. This is not buying and selling recommendation. I'm not SEBI registered.

SUPRIYA | SWING | LONGBase Over Base
20 EMA is following price, thus, showing momentum
Price has room to move

SUPRIYA | SWING | LONGBase Over Base
20 EMA is following price, thus, showing momentum
Price has room to move

SUPRIYA LIFESCINCEThis stock is ready for move in higher territory as it confirm double bottom. followed by awsome volume and 20 MA at weekly time frame.
This stock has a heavy subscription during its ipo.
buy above today candle sl will be weekly candle low.
i am not giving level of entry and sl so that u can learn how to put sl.

Supriya Lifescience Ltdfoe me its a cup and handle pattern, even measurements are not marching
Supriya Lifescience is engaged in the manufacturing of Active pharmaceutical ingredients (APIs). As of March 31, 2021, the company produces 38 APIs focused on diverse therapeutic segments such as antihistamine, analgesic, anaesthetic, vitamin, anti-asthmatic and anti-allergic.
The Co. has a niche product basket of 38 APIs. It offers a product mix of various therapeutic segments such as Anti-Histamine, Anti-Allergics, Vitamins, Anesthetics, Anti- Asthmatics etc. It has been the largest exporter of products in anti-histamine, anesthetics and anti-asthma therapies.


SUPRIYAStock name = Supriya Lifescience Limited.
Weekly chart setup
Chart is self explanatory. Levels of breakout, possible up-moves (where stock may find resistances) and support (close below which, setup will be invalidated) are clearly defined.
Master Score - C
Disclaimer: This is for demonstration and educational purpose only. this is not buying and selling recommendations. I am not SEBI registered. please consult your financial advisor before taking any trade.

Supriya : Sustained BreakoutsSupriya :
All previous breakouts were sustained
Long only above 341 with support at 330

Supriya Life science Weekly Timeframe analysis for long term
NSE:SUPRIYA has formed clear bullish structure and taken solid bounce from support 237-250 zone.
Buy Level is 283. We can see long term move above 300 with SL of 260 if it give pullback buy more near 280 to 290 range.
Major targets levels are highlighted in blue lines.

Supriya made a baseSupriya, can run for 277 and 290 levels
Wait to cross 258
Keep stop loss as 240 on day close basis

Supriya Lifescience LtdSupriya Lifescience is engaged in the manufacturing of Active pharmaceutical ingredients (APIs). As of March 31, 2021, the company produces 38 APIs focused on diverse therapeutic segments such as antihistamine, analgesic, anaesthetic, vitamin, anti-asthmatic and anti-allergic.

