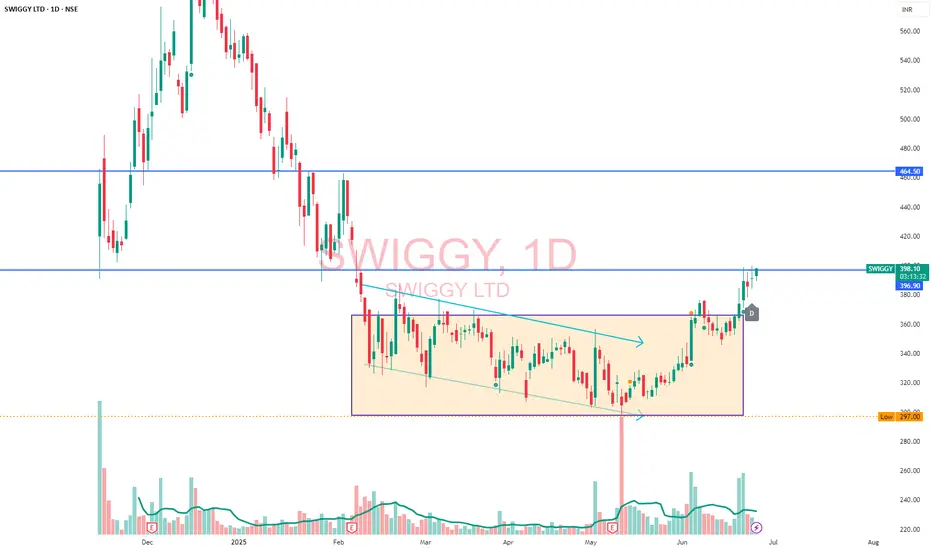
SWIGGY LimitedKeep this stock on radar... looking good on daily chart frame.. Potential target can be seen 410, 420 in short span.
SWIGGY trade ideas
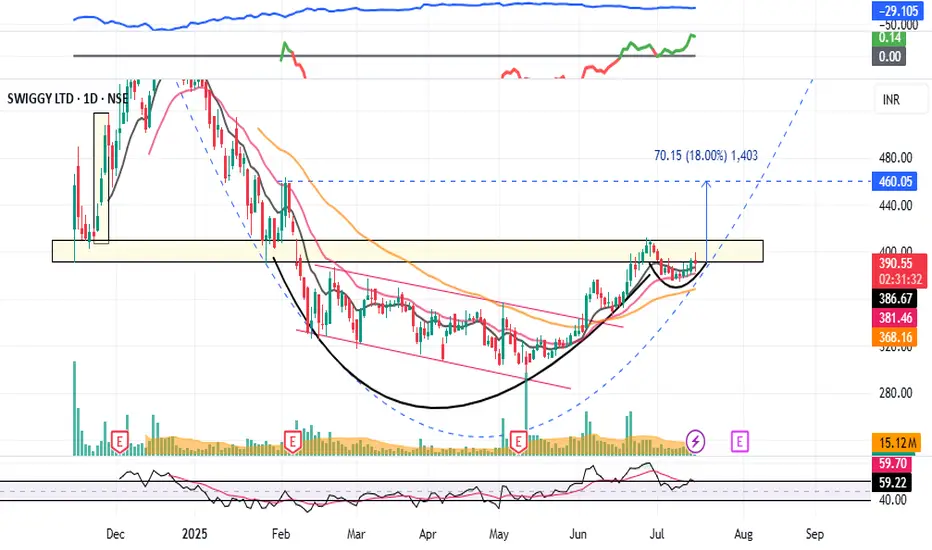
SWIGGY - Breakout Soon (1-3 months)#SWIGGY #breakoutstock #patterntrading #cupandhandle #roundingbottom #trendingstock
SWIGGY : Swing Trade (1-3 Months)
>> Breakout candidate
>> Trending stock
>> Cup and handle pattern
>> Rounding bottom in the long run
>> Good Strength & Volumes Dried up
Swing Traders can lock profit at 10% and keep trailing
Pls Boost, Comment & Follow for more analysis
Disc : Charts shared are for Learning purpose not a Trade Recommendation, Take postions only after consulting your Financial Advisor or a SEBI Registered Advisor.
SWIGGY Breaking out of Rouding Bottom PatternNSE:SWIGGY is breaking out of Rouding Bottom Pattern. You can Buy at 398 and Target for 420. Keep Stop loss at 370. The Points that you will gain here is 22 points and since the stock price is less, you can invest a little more and try gaining more profit.
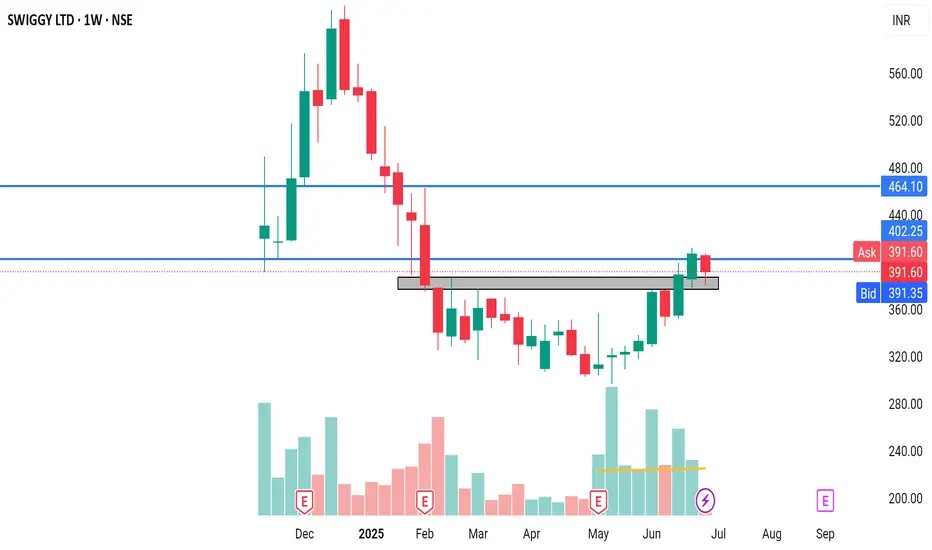
Amazing breakout on WEEKLY Timeframe - SWIGGYCheckout an amazing breakout happened in the stock in Weekly timeframe, macroscopically seen in Daily timeframe. Having a great favor that the stock might be bullish expecting a staggering returns of minimum 25% TGT. IMPORTANT BREAKOUT LEVELS ARE ALWAYS RESPECTED!
NOTE for learners: Place the breakout levels as per the chart shared and track it yourself to get amazed!!
#No complicated chart patterns
#No big big indicators
#No Excel sheet or number magics
TRADE IDEA: WAIT FOR THE STOCK TO BREAKOUT IN WEEKLY TIMEFRAME ABOVE THIS LEVEL.
Checkout an amazing breakout happened in the stock in Weekly timeframe.
Breakouts happening in longer timeframe is way more powerful than the breakouts seen in Daily timeframe. You can blindly invest once the weekly candle closes above the breakout line and stay invested forever. Also these stocks breakouts are lifelong predictions, it means technically these breakouts happen giving more returns in the longer runs. Hence, even when the scrip makes a loss of 10% / 20% / 30% / 50%, the stock will regain and turn around. Once they again enter the same breakout level, they will flyyyyyyyyyyyy like a ROCKET if held in the portfolio in the longer run.
Time makes money, GREEDY & EGO will not make money.
Also, magically these breakouts tend to prove that the companies turn around and fundamentally becoming strong. Also the magic happens when more diversification is done in various sectors under various scripts with equal money invested in each N500 scripts.
The real deal is when to purchase and where to purchase the stock. That is where Breakout study comes into play.
Check this stock which has made an all time low and high chances that it makes a "V" shaped recovery.
> Taking support at last years support or breakout level
> High chances that it reverses from this point.
> Volume dried up badly in last few months / days.
> Very high suspicion based analysis and not based on chart patterns / candle patterns deeply.
> VALUABLE STOCK AVAILABLE AT A DISCOUNTED PRICE
> OPPURTUNITY TO ACCUMULATE ADEQUATE QUANTITY
> MARKET AFTER A CORRECTION / PANIC FALL TO MAKE GOOD INVESTMENT
DISCLAIMER : This is just for educational purpose. This type of analysis is equivalent to catching a falling knife. If you are a warrior, you throw all the knives back else you will be sorrow if it hits SL. Make sure to do your analysis well. This type of analysis only suits high risks investor and whose is willing to throw all the knives above irrespective of any sectoral rotation. BE VERY CAUTIOUS AS IT IS EXTREME BOTTOM FISHING.
HOWEVER, THIS IS HOW MULTIBAGGERS ARE CAUGHT !
STOCK IS AT RIGHT PE / RIGHT EVALUATION / MORE ROAD TO GROW / CORRECTED IV / EXCELLENT BOOKS / USING MARKET CRASH AS AN OPPURTUNITY / EPS AT SKY.
LET'S PUMP IN SOME MONEY AND REVOLUTIONIZE THE NATION'S ECONOMY!
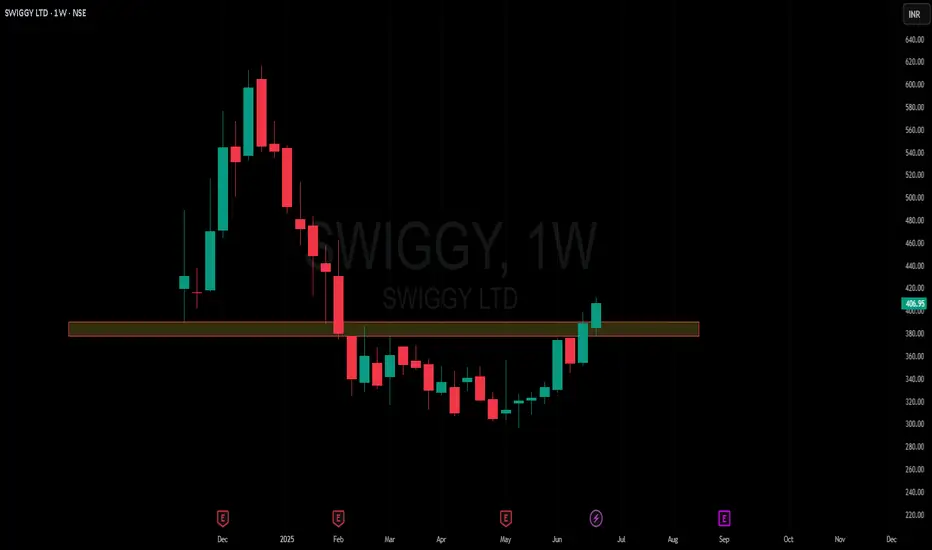
SWIGGY – Rounded Bottom Breakout with Volume SurgePattern: Rounded bottom
Breakout level: ₹345
Current price: ₹355.55 (+6.71%)
Volume: 24.64M (above 20-day average of 20.91M)
RSI: 66.27 – strong bullish momentum
Target: ₹409 (18 percent upside)
Stop-loss: ₹324
Invalidation: Close below ₹340 with volume
Context:
A well-defined rounded base has broken out with strong follow-through. Volume exceeds the average, RSI confirms momentum, and the breakout candle shows no selling pressure. A bullish divergence in RSI had already signaled accumulation before price action confirmed it. Coverage initiation by Morgan Stanley aligns with, but does not drive, the technical breakout.
Disclaimer:
This analysis is intended for informational and educational purposes only and does not constitute financial, investment, or trading advice. Trading and investing in equities involve risk, including the risk of capital loss. The pattern recognition and breakout setup described here are based purely on technical chart analysis, without consideration of the company’s financial statements, earnings outlook, or valuation metrics. Market conditions can change rapidly, and price targets or stop-loss levels may not be respected under volatile scenarios. Always consult your financial advisor and conduct your own due diligence before making any investment decisions.

SWIGGY - Higher HighsSwiggy has been the talk of the street this week and rightfully so. The chart shows a lot of positives here. Coming out of a base, good volumes coupled with a rising RS. The ingredients for a sustained trend are all there. Sub 400 prices should be a good spot to buy and accumulate.

SWIGGYSWIGGY
watch above levels. green line is our entry, redline is our SL. current level also good.
DISCLAIMER : I am NOT a SEBI registered advisor or a financial adviser. All the views are for educational purpose only.

SWIIGGY S/R Support and Resistance Levels:
Support Levels: These are price points (green line/shade) where a downward trend may be halted due to a concentration of buying interest. Imagine them as a safety net where buyers step in, preventing further decline.
Resistance Levels: Conversely, resistance levels (red line/shade) are where upward trends might stall due to increased selling interest. They act like a ceiling where sellers come in to push prices down.
Breakouts:
Bullish Breakout: When the price moves above resistance, it often indicates strong buying interest and the potential for a continued uptrend. Traders may view this as a signal to buy or hold.
Bearish Breakout: When the price falls below support, it can signal strong selling interest and the potential for a continued downtrend. Traders might see this as a cue to sell or avoid buying.
MA Ribbon (EMA 20, EMA 50, EMA 100, EMA 200) :
Above EMA: If the stock price is above the EMA, it suggests a potential uptrend or bullish momentum.
Below EMA: If the stock price is below the EMA, it indicates a potential downtrend or bearish momentum.
Trendline: A trendline is a straight line drawn on a chart to represent the general direction of a data point set.
Uptrend Line: Drawn by connecting the lows in an upward trend. Indicates that the price is moving higher over time. Acts as a support level, where prices tend to bounce upward.
Downtrend Line: Drawn by connecting the highs in a downward trend. Indicates that the price is moving lower over time. It acts as a resistance level, where prices tend to drop.
Disclaimer:
I am not a SEBI registered. The information provided here is for learning purposes only and should not be interpreted as financial advice. Consider the broader market context and consult with a qualified financial advisor before making investment decisions.

Swiggy (Swing):Swiggy (Swing):
Swiggy is well placed for a significant up move by breaking the recent resistance levels.
Trade offers a RR of more than 1:4.
Check out my earlier views for a better understanding.
Note: Do your own due diligence before taking any action.

SWIGGY MAY DELIVER ON TIME Swiggy's stock has been facing challenges recently, with its share price hitting an all-time low after the IPO lock-in period ended. The company has been struggling with profitability, and its losses widened to ₹1,081 crore in Q4FY25, compared to ₹555 crore in the same period last year. Despite this, analysts remain cautiously optimistic, with 13 out of 20 maintaining a "buy" rating on the stock.
Swiggy's food delivery business has shown strong growth, but its quick commerce segment, Instamart, has been underperforming compared to competitors like Blinkit. The company has been aggressively expanding its store count, but rising expenses have impacted its bottom line. Some analysts believe Swiggy is following a similar path to Paytm, struggling to convert losses into sustainable profits.
- Revenue Growth: Swiggy's revenue has been increasing steadily, with a 45% year-on-year growth.
- Profitability Concerns: The company reported a net loss of ₹1,081 crore in Q4FY25, nearly double the previous year.
- Market Sentiment: Analysts remain cautiously optimistic, with some maintaining a buy rating despite recent stock declines.
- Stock Price Target: The average long-term price target for Swiggy is ₹600, representing an 87.32% upside from its current price.
- Competitive Position: Swiggy continues to dominate the food delivery market, but its quick commerce segment (Instamart) faces stiff competition.
- Market Sentiment: Despite recent losses, Swiggy remains a midcap stock with strong investor interest.
Overall, Swiggy's stock is facing selling pressure, and traders may want to watch for breakout signals before making a move
BUT PERSONALLY I WILL ADD SOME QTY AT CURRENT LEVELS.

Swiggy Ltd view for Intraday 12th May #SWIGGY Swiggy Ltd view for Intraday 12th May #SWIGGY
Resistance 320 Watching above 321 for upside movement...
Support area 310 Below 315 ignoring upside momentum for intraday
Watching below 309 for downside movement...
Above 315 ignoring downside move for intraday
Charts for Educational purposes only.
Please follow strict stop loss and risk reward if you follow the level.
Thanks,
V Trade Point

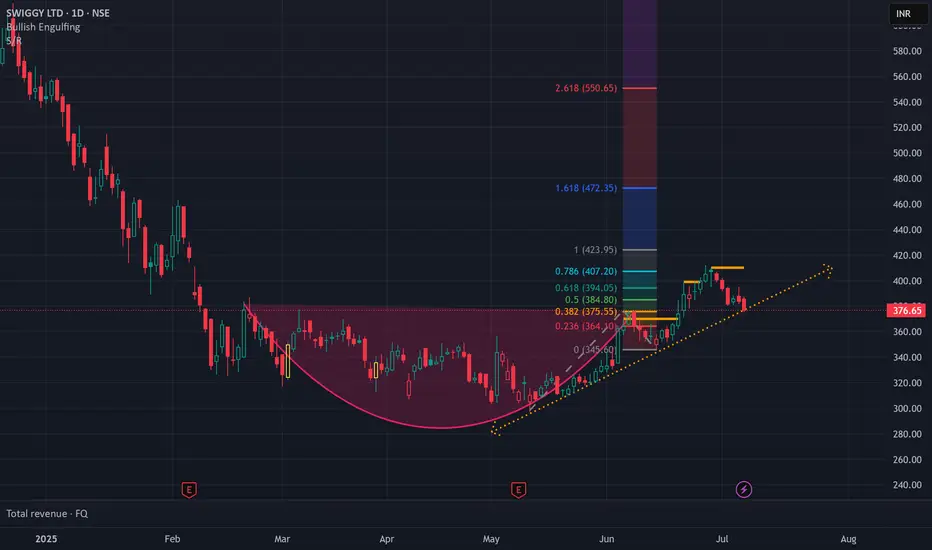
SWIGGY – Breakout Awaited with Strong Upside PotentialThe stock is currently consolidating near a critical support zone around ₹323-₹317, which has acted as a strong demand area. A strict stop-loss below ₹311 is recommended for risk management.
A breakout above the descending trendline resistance could trigger a bullish rally, targeting levels of ₹400, ₹500, and eventually ₹600+ in the coming weeks. The price structure suggests a higher low formation, indicating potential trend reversal.
📌 Key Levels to Watch:
Support: ₹323-₹317
Resistance: ₹360-₹380 (trendline breakout zone)
Target: ₹400 / ₹500 / ₹600+
Stop-Loss: Below ₹311
⚠️ Disclaimer: This is for educational purposes only. Do your own research before making any trading decisions.

SWIGGY S/R for 23/12/24Support and Resistance Levels:
Support Levels: These are price points (green line/shade) where a downward trend may be halted due to a concentration of buying interest. Imagine them as a safety net where buyers step in, preventing further decline.
Resistance Levels: Conversely, resistance levels (red line/shade) are where upward trends might stall due to increased selling interest. They act like a ceiling where sellers come in to push prices down.
Breakouts:
Bullish Breakout: When the price moves above resistance, it often indicates strong buying interest and the potential for a continued uptrend. Traders may view this as a signal to buy or hold.
Bearish Breakout: When the price falls below support, it can signal strong selling interest and the potential for a continued downtrend. Traders might see this as a cue to sell or avoid buying.
MA Ribbon (EMA 20, EMA 50, EMA 100, EMA 200) :
Above EMA: If the stock price is above the EMA, it suggests a potential uptrend or bullish momentum.
Below EMA: If the stock price is below the EMA, it indicates a potential downtrend or bearish momentum.
Trendline: A trendline is a straight line drawn on a chart to represent the general direction of a data point set.
Uptrend Line: Drawn by connecting the lows in an upward trend. Indicates that the price is moving higher over time. Acts as a support level, where prices tend to bounce upward.
Downtrend Line: Drawn by connecting the highs in a downward trend. Indicates that the price is moving lower over time. It acts as a resistance level, where prices tend to drop.
Disclaimer:
I am not a SEBI registered. The information provided here is for learning purposes only and should not be interpreted as financial advice. Consider the broader market context and consult with a qualified financial advisor before making investment decisions.

SwiggyA good rally is being expected in swiggy as the stock has broke ath and with very good daily candle

SWIGGY S/R for 16/12/24Support and Resistance Levels:
Support Levels: These are price points (green line/shade) where a downward trend may be halted due to a concentration of buying interest. Imagine them as a safety net where buyers step in, preventing further decline.
Resistance Levels: Conversely, resistance levels (red line/shade) are where upward trends might stall due to increased selling interest. They act like a ceiling where sellers come in to push prices down.
Breakouts:
Bullish Breakout: When the price moves above resistance, it often indicates strong buying interest and the potential for a continued uptrend. Traders may view this as a signal to buy or hold.
Bearish Breakout: When the price falls below support, it can signal strong selling interest and the potential for a continued downtrend. Traders might see this as a cue to sell or avoid buying.
MA Ribbon (EMA 20, EMA 50, EMA 100, EMA 200) :
Above EMA: If the stock price is above the EMA, it suggests a potential uptrend or bullish momentum.
Below EMA: If the stock price is below the EMA, it indicates a potential downtrend or bearish momentum.
Trendline: A trendline is a straight line drawn on a chart to represent the general direction of a data point set.
Uptrend Line: Drawn by connecting the lows in an upward trend. Indicates that the price is moving higher over time. Acts as a support level, where prices tend to bounce upward.
Downtrend Line: Drawn by connecting the highs in a downward trend. Indicates that the price is moving lower over time. It acts as a resistance level, where prices tend to drop.
Disclaimer:
I am not a SEBI registered. The information provided here is for learning purposes only and should not be interpreted as financial advice. Consider the broader market context and consult with a qualified financial advisor before making investment decisions.

SWIGGY LTD S/R for 27/11/24Support and Resistance Levels:
Support Levels: These are price points (green line/shade) where a downward trend may be halted due to a concentration of buying interest. Imagine them as a safety net where buyers step in, preventing further decline.
Resistance Levels: Conversely, resistance levels (red line/shade) are where upward trends might stall due to increased selling interest. They act like a ceiling where sellers come in to push prices down.
Breakouts:
Bullish Breakout: When the price moves above resistance, it often indicates strong buying interest and the potential for a continued uptrend. Traders may view this as a signal to buy or hold.
Bearish Breakout: When the price falls below support, it can signal strong selling interest and the potential for a continued downtrend. Traders might see this as a cue to sell or avoid buying.
20 EMA (Exponential Moving Average):
Above 20 EMA(50 EMA): If the stock price is above the 20 EMA, it suggests a potential uptrend or bullish momentum.
Below 20 EMA: If the stock price is below the 20 EMA, it indicates a potential downtrend or bearish momentum.
Trendline: A trendline is a straight line drawn on a chart to represent the general direction of a data point set.
Uptrend Line: Drawn by connecting the lows in an upward trend. Indicates that the price is moving higher over time. Acts as a support level, where prices tend to bounce upward.
Downtrend Line: Drawn by connecting the highs in a downward trend. Indicates that the price is moving lower over time. It acts as a resistance level, where prices tend to drop.
RSI: RSI readings greater than the 70 level are overbought territory, and RSI readings lower than the 30 level are considered oversold territory.
Combining RSI with Support and Resistance:
Support Level: This is a price level where a stock tends to find buying interest, preventing it from falling further. If RSI is showing an oversold condition (below 30) and the price is near or at a strong support level, it could be a good buy signal.
Resistance Level: This is a price level where a stock tends to find selling interest, preventing it from rising further. If RSI is showing an overbought condition (above 70) and the price is near or at a strong resistance level, it could be a signal to sell or short the asset.
Disclaimer:
I am not a SEBI registered. The information provided here is for learning purposes only and should not be interpreted as financial advice. Consider the broader market context and consult with a qualified financial advisor before making investment decisions.

SWIGGY : INTRADAY RANGESWIGGY's stock is trading near a critical support level of ₹430. If this support level is breached, we could anticipate a potential decline of approximately 6%. This could signify a bearish trend, leading to further downward pressure on the stock price. Investors need to monitor this level closely, as a break below ₹430 might prompt selling activity and increase volatility.

SWIGGY S/R for 18/11/24Support and Resistance Levels:
Support Levels: These are price points (green line/shade) where a downward trend may be halted due to a concentration of buying interest. Imagine them as a safety net where buyers step in, preventing further decline.
Resistance Levels: Conversely, resistance levels (red line/shade) are where upward trends might stall due to increased selling interest. They act like a ceiling where sellers come in to push prices down.
Breakouts:
Bullish Breakout: When the price moves above resistance, it often indicates strong buying interest and the potential for a continued uptrend. Traders may view this as a signal to buy or hold.
Bearish Breakout: When the price falls below support, it can signal strong selling interest and the potential for a continued downtrend. Traders might see this as a cue to sell or avoid buying.
20 EMA (Exponential Moving Average):
Above 20 EMA(50 EMA): If the stock price is above the 20 EMA, it suggests a potential uptrend or bullish momentum.
Below 20 EMA: If the stock price is below the 20 EMA, it indicates a potential downtrend or bearish momentum.
Trendline: A trendline is a straight line drawn on a chart to represent the general direction of a data point set.
Uptrend Line: Drawn by connecting the lows in an upward trend. Indicates that the price is moving higher over time. Acts as a support level, where prices tend to bounce upward.
Downtrend Line: Drawn by connecting the highs in a downward trend. Indicates that the price is moving lower over time. It acts as a resistance level, where prices tend to drop.
RSI: RSI readings greater than the 70 level are overbought territory, and RSI readings lower than the 30 level are considered oversold territory.
Combining RSI with Support and Resistance:
Support Level: This is a price level where a stock tends to find buying interest, preventing it from falling further. If RSI is showing an oversold condition (below 30) and the price is near or at a strong support level, it could be a good buy signal.
Resistance Level: This is a price level where a stock tends to find selling interest, preventing it from rising further. If RSI is showing an overbought condition (above 70) and the price is near or at a strong resistance level, it could be a signal to sell or short the asset.
Disclaimer:
I am not a SEBI registered. The information provided here is for learning purposes only and should not be interpreted as financial advice. Consider the broader market context and consult with a qualified financial advisor before making investment decisions.
