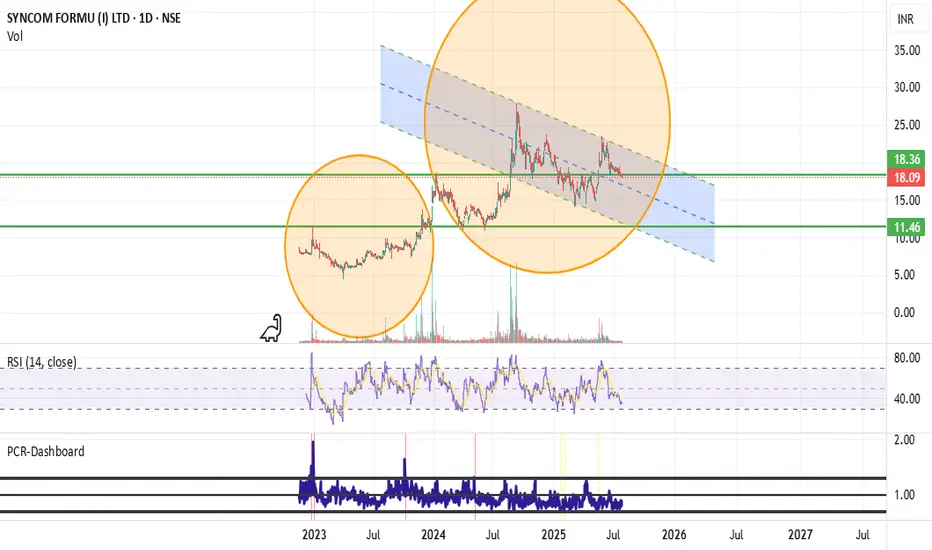
Long on Syncom FormulationThe chart normally gives a cup with handle and then a breakout and then a retest and then moves up high.
This is the second time it is giving a similar pattern of breakout and then retest on weekly candles. Had a look at the fundamentals and it looks good too. Will track this stock. I think this wi
0.50 INR
494.35 M INR
4.65 B INR
462.33 M
About SYNCOM FORMU (I) LTD
Sector
Industry
CEO
Vijay Shankarlal Bankda
Website
Headquarters
Indore
Founded
1988
ISIN
INE312C01025
FIGI
BBG000D7VHB5
Syncom Formulations (India) Ltd. is a pharmaceutical company, which engages in the development, manufacture, and marketing of healthcare products. The company operates through the following segments: Pharmaceutical Drugs and Formulations, Trading of Commodities, and Renting of Property. The company was founded by Kedarmal Shankarlal Bankda, Ajay Kumar Bankda, and Vijay Shankarlal Bankda on June 21, 1988 and is headquartered in Indore, India.
Related stocks
Syncom looking good Syncom formulations looking good
And try to break trendline
Also create good base in this range

Inverse Head and Shoulders Pattern - SYNCOMFHey traders,
I wanted to share an interesting swing trading setup I spotted on the SYNCOM FORMU (I) LTD daily chart. The stock has formed a classic inverse head and shoulders pattern, which is a bullish reversal signal. This pattern is characterized by three troughs, with the middle trough (the hea

SYNCOM-Rounding bottom Formation[Weekly and Daily Time Frame]Stock has shown postive momentum during last week. It has completed rounding bottom formation on daily and weekly chart time frame. Expecting continuation of the postive momentum in coming weeks as well.
Good Buying Price - 17.5 till 14.5
SL - 13.5
TGT - 25
Disclaimer - Not a Sebi registered advis

SYNCOM FORMU STOCK FOR SWING TRADING8 MONTHS OF SUPPLY ZONE BREAKOUT
BUY PRICE : 19
SL : 14 (only for swing traders)
TARGET : 26 (40%)
Disclaimer - All information on this page is for educational purposes only, we are not SEBI Registered, Please consult a SEBI registered financial advisor for your financial matters before invest

$SYNCOM 3R Swing idea analysisBSE:SYNCOM weekly is showing good imbalance to capture an 7R swing . but if we factor in Daily gaps and daily OB's it is a 3R opportunity. This could be a 3+ month opportunity.
What is your view ?

SYNCOM FORMULATIONS (INDIA) LT SYNCOM FORMULATIONS (INDIA) LT Is Correct Time For Buy
Market Buy Entry : 8.88 Price
Market Exit : 13.50 Price
There Are Get More than 50% Profit -- Estimation Time Working Days 50 -60 Days Get Upto 50% Profit
Ex:
Minimum Calculation :
Investment : 10,000
Profit : 5,

syncomf buy trendin this stock respect trendline and lower timeframe 4 hour trend reversal conformation after u can buy = 14 or 15 rupees and first target = 20 rupees , next target=24

Syncom Formulation IndiaSun Storm Investment Trading Desk & NexGen Wealth Management Service Present's: SSITD & NexGen Portfolio of the Week Series
Focus: Worldwide
By Sun Storm Investment Research & NexGen Wealth Management Service
A Profit & Solutions Strategy & Research
Trading | Investment | Stocks | ETF | Mutua

See all ideas
Summarizing what the indicators are suggesting.
Oscillators
Neutral
SellBuy
Strong sellStrong buy
Strong sellSellNeutralBuyStrong buy
Oscillators
Neutral
SellBuy
Strong sellStrong buy
Strong sellSellNeutralBuyStrong buy
Summary
Neutral
SellBuy
Strong sellStrong buy
Strong sellSellNeutralBuyStrong buy
Summary
Neutral
SellBuy
Strong sellStrong buy
Strong sellSellNeutralBuyStrong buy
Summary
Neutral
SellBuy
Strong sellStrong buy
Strong sellSellNeutralBuyStrong buy
Moving Averages
Neutral
SellBuy
Strong sellStrong buy
Strong sellSellNeutralBuyStrong buy
Moving Averages
Neutral
SellBuy
Strong sellStrong buy
Strong sellSellNeutralBuyStrong buy
Displays a symbol's price movements over previous years to identify recurring trends.
Frequently Asked Questions
The current price of SYNCOMF is 18.19 INR — it has decreased by −0.87% in the past 24 hours. Watch SYNCOM FORMU (I) LTD stock price performance more closely on the chart.
Depending on the exchange, the stock ticker may vary. For instance, on NSE exchange SYNCOM FORMU (I) LTD stocks are traded under the ticker SYNCOMF.
SYNCOMF stock has fallen by −1.03% compared to the previous week, the month change is a −5.80% fall, over the last year SYNCOM FORMU (I) LTD has showed a 15.35% increase.
SYNCOMF reached its all-time high on Sep 10, 2024 with the price of 27.90 INR, and its all-time low was 4.60 INR and was reached on Mar 29, 2023. View more price dynamics on SYNCOMF chart.
See other stocks reaching their highest and lowest prices.
See other stocks reaching their highest and lowest prices.
SYNCOMF stock is 4.26% volatile and has beta coefficient of 1.46. Track SYNCOM FORMU (I) LTD stock price on the chart and check out the list of the most volatile stocks — is SYNCOM FORMU (I) LTD there?
Today SYNCOM FORMU (I) LTD has the market capitalization of 17.10 B, it has decreased by −0.05% over the last week.
Yes, you can track SYNCOM FORMU (I) LTD financials in yearly and quarterly reports right on TradingView.
SYNCOMF net income for the last quarter is 176.94 M INR, while the quarter before that showed 130.02 M INR of net income which accounts for 36.09% change. Track more SYNCOM FORMU (I) LTD financial stats to get the full picture.
SYNCOM FORMU (I) LTD dividend yield was 0.00% in 2024, and payout ratio reached 0.00%. The year before the numbers were 0.00% and 0.00% correspondingly. See high-dividend stocks and find more opportunities for your portfolio.
EBITDA measures a company's operating performance, its growth signifies an improvement in the efficiency of a company. SYNCOM FORMU (I) LTD EBITDA is 550.98 M INR, and current EBITDA margin is 11.64%. See more stats in SYNCOM FORMU (I) LTD financial statements.
Like other stocks, SYNCOMF shares are traded on stock exchanges, e.g. Nasdaq, Nyse, Euronext, and the easiest way to buy them is through an online stock broker. To do this, you need to open an account and follow a broker's procedures, then start trading. You can trade SYNCOM FORMU (I) LTD stock right from TradingView charts — choose your broker and connect to your account.
Investing in stocks requires a comprehensive research: you should carefully study all the available data, e.g. company's financials, related news, and its technical analysis. So SYNCOM FORMU (I) LTD technincal analysis shows the sell today, and its 1 week rating is sell. Since market conditions are prone to changes, it's worth looking a bit further into the future — according to the 1 month rating SYNCOM FORMU (I) LTD stock shows the neutral signal. See more of SYNCOM FORMU (I) LTD technicals for a more comprehensive analysis.
If you're still not sure, try looking for inspiration in our curated watchlists.
If you're still not sure, try looking for inspiration in our curated watchlists.