"SYNGENE: Favorable Support with Minimal Downside Risk"SYNGENE is currently well-supported, suggesting potential for further upward movement. The downside risk appears minimal, making it a potentially worthwhile trade opportunity. Even in the event of failure, the potential loss is expected to be limited.
SYNGENE trade ideas


SYNGENE Long Trade🔔 BUY Signal Alert! 🔔
🔗 Ticker: SYNGENE
🌐 Market: India Equities
🔄 Side: Long
⏱️ Type: Swing Trade
🎯 Entry: 729
🛑 Stop Loss: 704.2
🥇 First Profit Target: 752.4
🏆 Final Profit Target: 788.2
The CHAMLEO EDGE model uses a proprietary algorithmic program at the pre-market auction to identify potential stocks for each day. The algorithm then calculates where there is strong buying or selling pressure on the stock and sends buy or sell signals.
The signal provides a suggested stop loss price based on calculations that the movement may no longer be valid. It also provides a first suggested level for realizing potential profits, indicating that there is a resistance level just beyond this price that may cause the stock to stop and possibly reverse. If this level is surpassed, there is potential to achieve possible profits at a price better than the first profit level, allowing the possibility of extending potential gains.

Flag Pattern Breakout and retestsimple flag previous pole which is 2x, and 3 years range bond flag pattern, and breakout,
new range is 2x same as previous pole.

🚀 Elevate your portfolio with "SYNGENE" 📈Exciting news - we've spotted a Bullish trade gem! 🌟 Dive into the potential of stock SYNGENE, boasting a Risk-Reward ratio of 1:3! 💹💼
🔥 Reasons to jump on board:
🧬 SYNGENE is set for impressive growth in the biotech sector.
💡 We've crunched the numbers; now, it's your turn to ride the wave.
📊 Explore how this trade could fuel your financial aspirations.
🚀 Ready to transform your investment game? Let's do it together! 💰

LOOKING GOOD FOR SMALL SWING Looking good for small swing 1:2 . not a big target it can be achieved in upcoming days

syngene international shareNSE:SYNGENE
standing at strong support 700
buy now for good returns
great fundamentals
target 1 858
trarget 2 1000
strong buy
price action NSE:SYNGENE

Syngene bearish pattern formingA head and shoulder pattern seems to be in formation.
The neckline based on the left recession and head recession at 756.9 & 763.05 is slightly upwards trending (would have preferred this to be downwards for a stronger bearish sentiment).
The region of 763.2 to 785.8 seems to be a relevant area, where the stock has spent a considerable time since 28th June 2023. Approximately 52 days in the 103 day period (~50%) from 28/6/2023 has been spent at this region.
This region acted as a strong resistance area initially i.e. before the left shoulder formation and after that has been a support area for the two recessions from the left shoulder and the head.
The Fib retracement level of 0.618 is a part of this region and there has been considerable activity around this region.
The neckline and the 0.618 fib level cross at around the level of 770. This would be the trigger price to start checking for a bearish confirmation. A significant volume breakdown to and below the level of 763 would suggest a strong bearish signal.

SYGIENCELooks Good for upmove.
Not a trade recommendation.
My trades for own backtesting the strategy.
Only for educational purpose.

SYNGENE INTERNATIONALnse:syngene international
current price 940
weekly breakout
flag breakout
great fundamentals
keep on buy for great profits
consolidation breakout
100% buy rating
1st target - 900

MAY RISK 2.5% IN NSE:SYNGENE INTERNATIONALwhenever a stock rally near or at ATH never look for the retracements instead look for valid pullbacks , so, by which can join the rally. Here, NSE:SYNGENE is given an opportunity to participate in the rally by risking 2.5% for the gain of 8.5% or even more and can enter the trade above 28/08/2023 candle's high by placing strict stoploss below the candle's low.

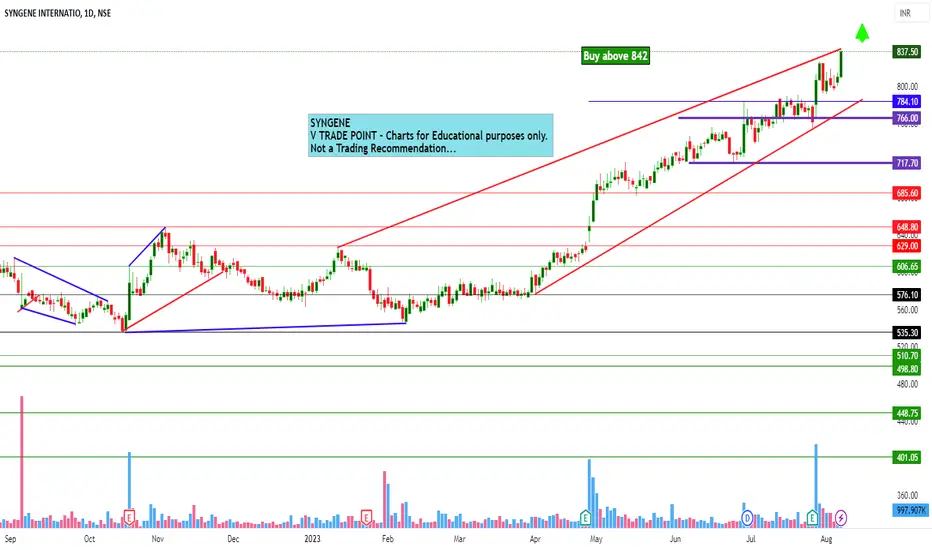
Syngene international view for tomorrow 8th AugSyngene international view for tomorrow 8th Aug
842 above expecting upside move... 833 area will be having support...so better to keep sl for that area depends upon the intraday view for tomorrow
Follow strict risk reward and stop loss
Charts for Educational purposes only.
Thanks,
V Trade Point
Syngene ready for 637Charting is not only a science, its an art, its for those who have blend of analytical mind and good observation skills.
syngene can next touch 637

SYNGENEBuy on dip. awsome break out on monthly TF. it will retrace in next two or three days. gud target of 100 with sl

Sygene International Breakout monthly chartHi every one
Sygene international breakout ho gaya hai
you can add this stock in portfolio

Syngene weekly break outSyngene has been consolidating forming the triangle pattern since several weeks now and has broken out > 615 . We will be seeing good gains in the next few weeks with a target price of 670-680

Syngene - Breakout after a long timeAfter facing resistance at 640-660 zone, NSE:SYNGENE has finally given breakout.
The Company is also an Easy Earnings Comparison candidate with better visibility of June quarter results.
Easy Earnings Comparison is a case where the probability of reporting bumper results in the next upcoming quarter is high. The concept of EEC is explained in the book ‘Insider Buy Superstocks’ by Jesse Stine.

Syngene breakout on daily chartThe series of consolidation patterns can be an indication that the stock is gearing up for a significant move, and trading above all key moving averages can suggest a strong bullish trend. Finally, the recent all-time high breakout is a clear signal of the stock's upward momentum.
Remember to always trade with caution and to carefully consider your risk management strategy before making any trades. Happy trading!

SYNGENE Looks StrongSYNGENE looks strong
1. Tried 3 times to cross the highs as highlighted
2. This time it broke out the range with a strong bullish candle and strong RSI
3. Levels of 830++ on the cards
4. Time line 1 Month

Syngene International Ltd.Syngene International Ltd.
C&H Pattern: Monthly Basis
Price BreakOut. Need to be Watched. If Sustain, Then Good to Go!!!
Vol. BreakOut & Continued BuiltUp.
*With Upside, Trail SL*
*Book Profit as per Risk Appetite*
*Do Your Own Research as Well. This is Just an Opinion.*
Happy Investing :)


Breakout 📈Syngene international chart breakout two and half years consolidation and triangle break out ready to hit new 52weak High
Take one risk not for buy and sell just sharing knowledge

Syngene positional bet for 800 targetsSyngene has been consolidating since July 2021 and now it seems that it has completed its consolidation.Weekly close above 630 zones can kick start journey towards 750- 800 targets. Stop weekly close below 595. Good Risk to reward set up.
