Tata Chemical, #tata chem# tata chemical📉 Trend Reversal from ₹790–₹800 Support Zone
'W' pattern formed on daily chart — trend reversal signal.
Bottom range & neckline breakout confirm bullish momentum.
Price consolidating above W base, showing strength.
📈 Bias: Bullish above neckline; potential for further upside.
🗓️ Upcoming Event: Q1 results due soon — may act as a trigger for next move.
⚠️ Risk: Breakdown below ₹890 could negate the setup CMP = 962.65 total 70 points nearly 7% SL.
TATACHEM trade ideas

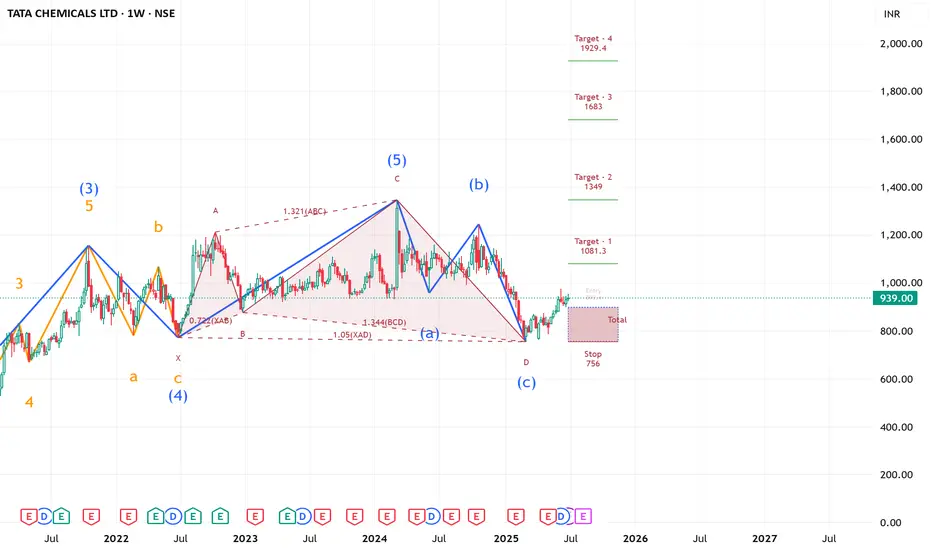
TATA CHEMICALS Ready to FIRE ( LONG TERM IDEA ) !!!TATA CHEMICALS' weekly counts indicate a bullish wave structure.
Both appear to be optimistic, and this stock's invalidation number is 756.
Investing in declines is a smart move for long-term players.
Long-term investors prepare for strong returns over the next two to five years.
TOP PLAYER IN THE INDUSTRY OF CHEMICALS
Every graphic used to comprehend the theory of elliot waves, harmonic waves, gann theory, and time theory
Every chart is for educational purposes.
We have no accountability for profit or loss.
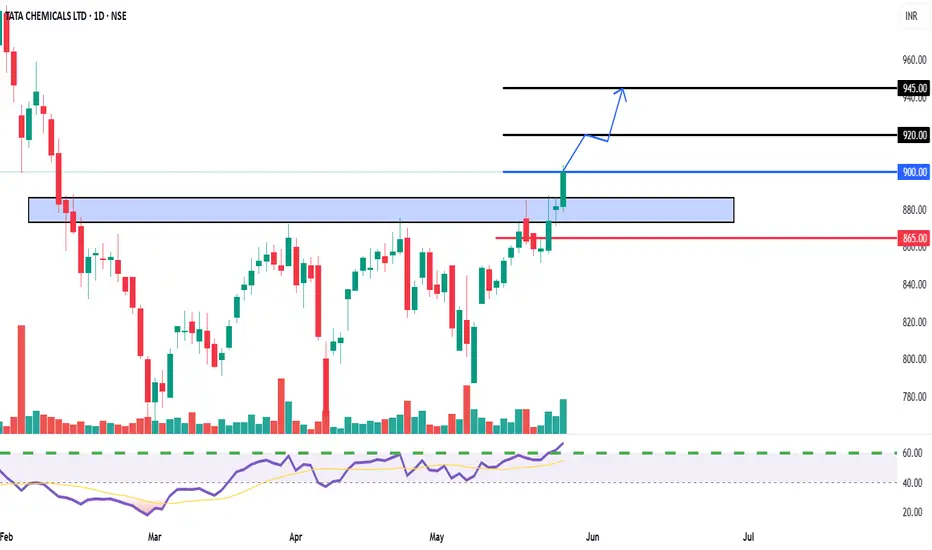
TATA CHEMICALS Breakout Confirmed - Buy on MomentumEntry Price:
Aggressive Entry: Around CMP (₹900-₹905)
Conservative Entry: On a retest of the breakout zone (₹875-₹885), if the opportunity arises.
Target Price 1 (T1): ₹920
Target Price 2 (T2): ₹945
Stop Loss (SL): ₹865 (Closing basis below the breakout zone and previous support)
TATACHEM | Buy @LTP | SL below 870 | 1st Target 980Disclaimer:
This is not financial advice. Please do your own research or consult with a financial advisor before making any investment decisions. Investments in stocks can be risky and may result in loss of capital.

NATRIUM | Investing | Why BILL GATES is Betting on NATRIUMBill Gates is betting big on Natrium - should you be, too?
Natrium is this next-generation nuclear reactor design that's attracting a lot of attention from people like Bill Gates and other major investors. What's particularly interesting about it is that it combines a fast reactor with a built-in molten salt "battery." Essentially, it can generate a steady output of power and then provide an extra boost during peak demand by drawing on its stored heat. This design aims for greater flexibility in meeting fluctuating electricity needs.
The technology is a joint development by TerraPower, the company co-founded by Bill Gates, and GE Hitachi. They're presenting it as a zero-carbon power source capable of reliably backing up intermittent renewables like wind and solar, ensuring a consistent supply of clean energy.
The excitement from investors like Bill Gates appears to be driven by the need to address climate change and secure reliable energy supplies. They view Natrium as a way to deliver large-scale, carbon-free power while potentially overcoming some of the limitations of older nuclear reactor designs. Gates has emphasized the enhanced safety features and potential for lower operating costs. Furthermore, Natrium's specific design to complement the intermittency of solar and wind, through its energy storage, is a significant draw for investors looking at future energy solutions. The substantial public and private investment, including government funding and bipartisan legislative support, also signals strong confidence in this technology.
The description of TerraPower as a "Bill Gates-backed" firm developing this multi-billion dollar demonstration plant highlights the high-profile nature of the project. The fact that corporate partners, such as the data center company exploring Natrium for their power needs, are also getting involved indicates a broader recognition of its potential beyond just government initiatives.
Compared to traditional nuclear reactors, Natrium offers some potential advantages. Its sodium coolant operates at near-atmospheric pressure, simplifying safety compared to the high-pressure water systems in older designs. This allows for natural heat dissipation in case of issues, reducing the risk of large steam explosions. Another key aspect is Natrium's potential for more efficient fuel utilization and reduced long-lived waste generation. The design aims for better fuel efficiency and a smaller volume of long-term radioactive waste compared to current light-water reactors.
Natrium's primary advantage over wind and solar is its dispatchability. Unlike the intermittent nature of renewables, Natrium can provide power consistently, 24/7. The integrated energy storage allows it to complement renewables by absorbing excess energy or releasing power during periods of low renewable output. This firm grid support is a significant benefit for utilities concerned about grid stability and the variability of renewable sources.
For utilities transitioning away from coal, Natrium offers a carbon-free, relatively direct replacement in terms of power output. It also has a smaller land footprint compared to large-scale wind or solar installations.
There are inherent challenges with a first-of-a-kind system like Natrium. The prototype is still under construction, lacking a proven operational track record. Construction and licensing processes could face delays and cost overruns. Critics also raise valid points about the actual safety and cost-effectiveness compared to projections. The use of sodium coolant, while offering safety advantages, also presents risks due to its reactivity with air and water, requiring robust containment systems. Regulatory scrutiny will undoubtedly be extensive.
And fuel supply is a critical uncertainty. Natrium requires high-assay, low-enriched uranium (HALEU), which is not currently widely available. Disruptions in the supply chain and limited existing production capacity pose a significant risk to the timely and cost-effective operation of Natrium plants.
Looking ahead, Natrium is being considered for deployment in regions needing reliable power to complement renewables and to power energy-intensive industries. The long-term vision involves integrating Natrium with renewable energy sources to create a more stable and decarbonized grid.
The speculative outlook for Natrium in the next 5-10 years is heavily dependent on the successful completion of the Wyoming demonstration plant. If it meets its targets, it could pave the way for wider adoption. However, the timeline is ambitious, and challenges related to fuel supply and regulatory approvals remain. A successful demonstration could trigger significant investment and adoption in the coming decades, positioning Natrium as a key player in the energy transition.
If you're interested in investing in companies involved with TerraPower's Natrium reactor, several publicly traded firms are integral to its development and supply chain:
🔧 Engineering & Construction
KBR Inc. | (NYSE: KBR)
KBR has formed a strategic alliance with TerraPower to commercialize and deploy Natrium reactors globally. The collaboration focuses on creating a replicable contracting framework to reduce financial risk and ensure cost transparency in deploying Natrium technology.
terrapower.com
⚛️ Nuclear Fuel & Components
BWX Technologies Inc. | (NYSE: BWXT)
BWXT has been awarded a contract by TerraPower to design the Intermediate Heat Exchanger for the Natrium demonstration project. This component is critical for transferring heat within the reactor system.
Centrus Energy Corp. | (NYSE American: LEU)
Centrus Energy is collaborating with TerraPower to establish domestic production capabilities for high-assay, low-enriched uranium (HALEU), which is essential for fueling the Natrium reactor.
⚙️ Manufacturing & Industrial Partners
Doosan Enerbility Co., Ltd. | 034020.KQ (KOSDAQ)
Doosan Enerbility is supplying critical components for the Natrium reactor, including the core barrel and internal supports.
HD Hyundai | 329180.KQ
HD Hyundai is manufacturing the reactor vessel for the Natrium project.
🌍 International Collaborators
SK Inc. | 034730.KQ
SK Inc., a South Korean conglomerate, has invested $250 million in TerraPower to support the demonstration and commercialization of the Natrium reactor.
Korea Hydro & Nuclear Power (KHNP) | 15760.KS (KOSPI)
KHNP has entered into a strategic collaboration with TerraPower to support the Natrium project, leveraging its expertise in nuclear power development.
OTHERS:
1. Mirion Technologies (NYSE: MIR)
Mirion is supplying the Radiation Monitoring System (RMS) and Nuclear Instrumentation System (XIS) for the Natrium Reactor Demonstration Project in Wyoming.
2. GE Vernova (NYSE: GEV)
Through its subsidiary, Global Nuclear Fuel–Americas (GNF-A), GE Vernova is partnering with TerraPower to establish the Natrium Fuel Facility in Wilmington, North Carolina. This facility aims to produce high-assay, low-enriched uranium (HALEU) fuel essential for the Natrium reactor.
3. NuScale Power Corporation (NYSE: SMR)
While not directly involved with the Natrium project, NuScale is a prominent developer of small modular reactors (SMRs), a category that includes Natrium. The company's advancements in SMR technology contribute to the broader nuclear energy landscape.
4. Southern Company (NYSE: SO)
Southern Company is collaborating with TerraPower on the development of a molten chloride fast reactor (MCFR), a separate advanced nuclear project. Their involvement in advanced nuclear technologies aligns with the innovations seen in the Natrium project.
________________________________
Sources: Recent industry reports and news articles and TerraPower press releases provide the data above. Also put together with the help of AI.
world-nuclear-news.org, ans.org, gatesnotes.com, scientificamerican.com, terrapower.com, reuters.com

TATACHEM FORECAST FY24-FY26 HOT DZAMN :THE COMEBACK KIDI cant believe i missed a 500%'er like this really insoires you to research more
Just saw the discount advert (business news report cnbc) revenue looking messy negatives qq on qq on qq yuck if u know u know but its a industry problem
downgraded ratings by Morgan Stanley worst thing to have done to you but also you need to understand how to take the news
but honestly lotta potential for the future so ill watch as they sink it a lil you know discount and then i will pick up somewhere nice each upward trajectory on my zig zag is a point id consider but my last point is the time to buy
there is hope because the whole industry is taking a hit but it will overcome for sure
specialty chemicals with the help of a.i will be a force not reckoned with

TATACHEMNSE:TATACHEM
One Can Enter Now !
Or Wait for Retest of the Trendline (BO) !
Or wait For better R:R ratio !
Note :
1.One Can Go long with a Strict SL below the Trendline or Swing Low.
2. R:R ratio should be 1 :2 minimum
3. Plan as per your RISK appetite and Money Management.
Disclaimer : You are responsible for your Profits and loss, Shared for Educational purpose

tata chemicals is going to nose diveTata Chemicals Limited is a leading global company in the field of chemicals, specializing in diversified products across various industries, including agriculture, consumer goods, and industrial chemicals. A part of the prestigious Tata Group, the company was founded in 1939 and has since grown into one of the largest chemical manufacturers in the world. It is well known for producing soda ash, sodium bicarbonate, and other specialty chemicals used in glass, detergents, and food processing industries. Tata Chemicals is also a major player in the fertilizers sector, providing high-quality crop nutrition solutions to farmers. The company has a strong focus on sustainability and innovation, with a commitment to green chemistry and eco-friendly solutions. With operations spanning across India, North America, Europe, and Africa, Tata Chemicals continues to expand its global footprint while maintaining its dedication to ethical business practices and community welfare.

TATACHEM ANALYSISStock can be accumulated between 900 - 1000
Good margins and sales
Undervalued stock
Target 2000
Disclaimer : It's not a buy/sell recommendation. Posts/views are only for educational purpose.

TATA CHEMICAL DIVERGENCE 1 YEAR LOOKOUT CMP :1088
needs monthly closing above 1151 for first confirmation and 1251 final confirmation.
stuck in same range for long time with rsi divergence.
note : its just for educational purpose and not a trading call/tip.

Tata chemical - Struggling stock.It was time when EV was entering into Indian Market, and TATA Motors was one of the eminent players for EV production. Lithium-ion batteries was one the major requirements for production of EV, for that the main player for raw material was TATA chemicals as it was one the group companies of TATA group, which was directly getting benefitted by its group ecosystem, but any how now its last two years you can both the stocks of TATA motors and TATA chemicals, former has made more than double returns, but the latter one is struggling to move from its comfort space.
It seems most of the investors have forget about TATA chemicals, although the company is mainly into soda ash and also salt production. Still management is not into using its full potential.

TATA CHEMICALSWithout indicator only using tools having in trading view how fantasticaiiy you can find supports and resistance here is best example.

TATACHEM...BuyBuy=As tataachem has broken triangle ,Tgt shown on the chart calculated as per triangle rules
Time=in 4-5 months time.
Investors can buy...Traders can buy with stoploss just below the breakout point

Tata Chemicals Set for Bullish Swing, Targeting ₹1200-₹1220 Tata Chemicals is showing strong bullish momentum on the weekly chart, making it an attractive pick for swing traders. With a target range of ₹1200 to ₹1220 in the next 1 to 2 weeks, this stock is positioned for potential short-term gains.
Key Technical Highlights:
The stock has recently closed at ₹1128.65, marking a high over the past one to two months, indicating sustained strength.
Multiple RSI indicators are showing bullish momentum, reinforcing confidence in the uptrend.
The chart pattern suggests a clear bullish bias, making Tata Chemicals an appealing candidate for swing trading.
Trade Setup:
Target: ₹1200 to ₹1220
Stop Loss: ₹1092.60
Time Frame: 1 to 2 weeks for swing traders
Reason for the Buy Call:
Bullishness on the Weekly Chart: The stock has consistently shown strength, breaking through key resistance levels.
RSI Momentum: Multiple RSI indicators suggest ongoing upward pressure, confirming that buyers are in control.
Conclusion:
Tata Chemicals offers a solid swing trade opportunity, with technical indicators pointing towards further gains. With a target of ₹1200 to ₹1220 and a stop loss of ₹1092.60, this trade setup presents an attractive risk-to-reward ratio for swing traders.
Disclaimer: This is for educational purposes only and not financial advice. Please do your own research before making any investment decisions.

TatachemTata Chemicals
CMP 1132
Trendline breakout with volume
Tried 4th time to break trendline
Strong volume buildup

The stock of Tata Chemicals is currently following a box patternThe stock of Tata Chemicals is currently following a box pattern. Based on this pattern, if the stock price enters the second box, a trading opportunity arises with the following parameters:
- **Entry Condition:** Enter the trade when the stock price breaks into the second box.
- **Risk to Reward Ratio:** 1:2
- **Stop Loss:**when enter into box we will share
- **Target:** when enter into box we will share

Trapped between 2 trend lines. underperformed stock. Will see good up move above 1080. it is following wave pattern. once breaks 1080 we can see up move up to 1300 and then 1500.


TATACHEM + 200 SMA + 10 SMA + FIBO EXT + MACDThe most recent bull candle bodies are growing stronger day by day . The 200 SMA had been an important support for a long time . 10 SMA can provide trailing stop to the bulls.
The MACD histogram is rising and indicates upward trend . The MACD line has crossed over the signal line . Wait for it to come above 2 and the momentum may pick up . The 10 SMA can be used for trailing stop on longs.

TATACHEM LONG MONTHLYPRICE made a new high from this level. The daily level is also coinciding with weekly hence more probability


TATA CHEMICALS S/RSupport and Resistance Levels: In technical analysis, support and resistance levels are significant price levels where buying or selling interest tends to be strong. They are identified based on previous price levels where the price has shown a tendency to reverse or find support.
Support levels are represented by the green line and green shade, indicating areas where buying interest may emerge to prevent further price decline.
Resistance levels are represented by the red line and red shade, indicating areas where selling pressure may arise to prevent further price increases. Traders often consider these levels as potential buying or selling opportunities.
Breakouts: Breakouts occur when the price convincingly moves above a resistance level (red shade) or below a support level (green shade). A bullish breakout above resistance suggests the potential for further price increases, while a bearish breakout below support suggests the potential for further price declines. Traders pay attention to these breakout signals as they may indicate the start of a new trend or significant price movement.
20 EMA: The yellow line denotes 20 EMA, to interpret the 20 EMA, you need to compare it with the prevailing stock price. If the stock price is below the 20 EMA, it signals a possible downtrend. But if the stock price is above the 20 EMA, it signals a possible uptrend.
Disclosure: I am not SEBI registered. The information provided here is for learning purposes only and should not be interpreted as financial advice. It is important to consult with a qualified financial advisor before making any investment decisions. Tweets neither advice nor endorsement.

TATACHEM- Analysis Important levels :- 965 to 984 above this bullish below this bearish,
Bullish Levels -1024 to 1043 then 1143 to 1162 (new entry if day closing above this only) then 1261 to 1280 then 1380 to 1399
Bearish levels :- 925 to 906 (swing trade SL) then 806 to 787 (positional trade SL) then 688 to 669 (Long term investor SL) or use SL as per our comfort/risk management.
**Disclaimer -
I am not a SEBI registered analyst or advisor. I does not represent or endorse the accuracy or reliability of any information, conversation, or content. Stock trading is inherently risky and the users agree to assume complete and full responsibility for the outcomes of all trading decisions that they make, including but not limited to loss of capital. None of these communications should be construed as an offer to buy or sell securities, nor advice to do so. The users understands and acknowledges that there is a very high risk involved in trading securities. By using this information, the user agrees that use of this information is entirely at their own risk.
Thank you.
