TATA Motors Wedge breakout-- INTRADAYHello Fellow Traders,
Hope you are doing well. Tata motors after big rally need to cool off a bit to fill the potential gaps that is around 287-288 which aligns with the Fib level 61.8 . We will definitely most likely see a small profit booking then jump to higher levels again my stops will be just above the wedge and Targets will be 300,288 but along the way I will trail the stop loss to BE as it goes in my favour.
Short positions are risky. But, We have stops incase the market humbles me.
We are good and let's see how it goes.
Good Luck Traders
TATAMOTORS trade ideas

Tata Motors is consolidating:-1- Tata motors is consolidating for some days so big opportunity is laying ahead
2- It is in uptrend so another buying opportunity is expected.
3- Watch out for next bullish candles or bullish move in near future:-


Bullish flag and pole Tata MotorsHi Friends,
Keep an eye on Tata Motors or add it to your watchlist
It is forming a Bullish Flag and pole and can give a good target breakout anytime soon.
Keep Trading Keep Growing

TATA MOTOR SHORTHi
i see a big resistance here earlier but didn't confirm until resist price. at this moment market is over extended on daily and a clear divergence on it. but it doesn't mean market go down must form there. coz market on up trend and buyer are happy to buy this stocks. so market is reactive not predictive. so now we have to wait for break this black trend channel. and go to test previous major area for a bullish market change to bearish market. then i mark all the area where market try drop and bounce area. and last drop area. see you next for update


Tata motors flag breakout for 390+Tata motors is about to give another rally. Auto sector is also looking good. Tata motors will give an flag breakout soon and next target are 390+


TATA MOTORS VIEWTATA MOTORS VIEW NO TRADE RANG IS THERE WATCHOUT AND TRADE IF CROSSES SUPPORT AND RESIS


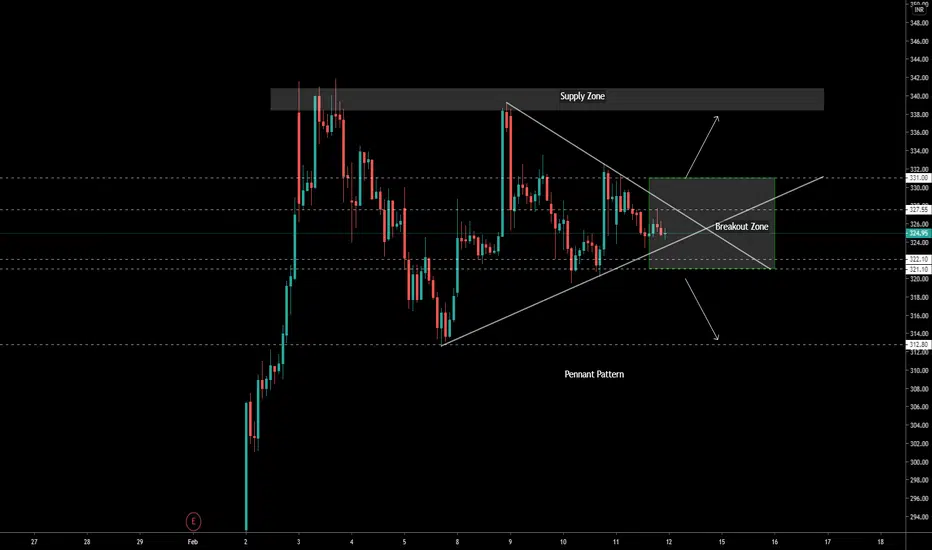
longTATAMOTORS @325
AFTER A SHARP UPMOVE TATAMOTOR MAKING PENNANT. BULLISH BREAKOUT ABOVE 342
SL 310
TARGETS MENTIONED BY UPPER LINES

TATAMOTORS IS ABOUT TO BREAK TRIANGLE PATTERNTATAMOTORS IS ABOUT TO BREAK TRIANGLE PATTERN,WAIT FOR BREAK AND RE-TEST


Tata motors on the verge of a Break out
Price action breakout soon
Symmetric triangle breakout
Consolidation for a long time. Higher chance to go higher