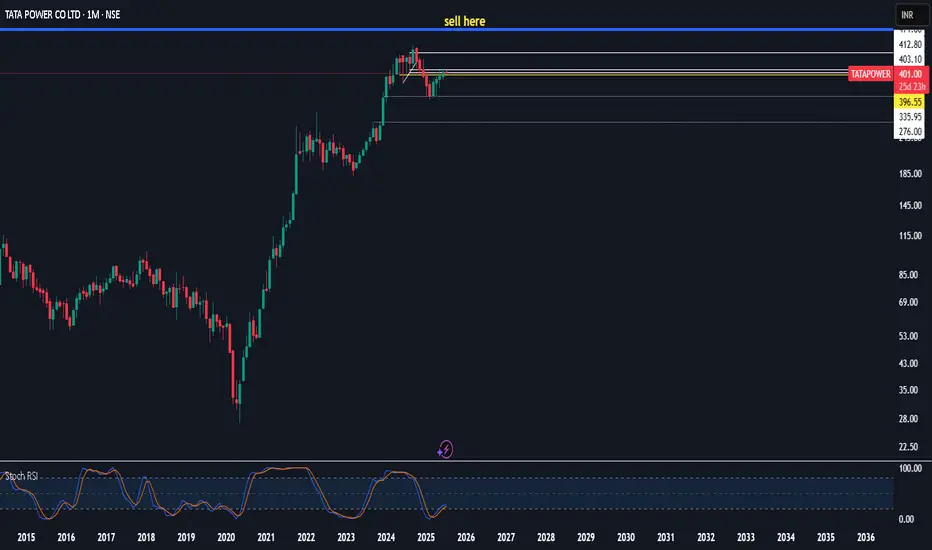
$tatapowerplease come back down i forgot to add u
rsi may dip one more time and give us a chance to reload but i doubt it since it has reclaimed the 7ema after deviating below it
dip was due to mangement getting off track stuff i belive is sorted now so to infinty and beyond!
TATAPOWER trade ideas
Tata Power is showing strengthTata Power's technical indicators suggest a strong buy signal based on moving averages and oscillators. Here’s a quick breakdown:
- Relative Strength Index (RSI): 65.04 (indicating bullish momentum)
- MACD: 3.38 (positive crossover, signaling upward trend)
- Moving Averages: All major SMAs and EMAs indicate a buy
- Pivot Points: Key support at ₹388.64, resistance at ₹398.69
Close Above 400 mark will be positive
- Short-Term Forecast: Technical analysis suggests support around ₹390 and resistance near ₹626, with a potential price target of ₹417.23 in the next two weeks.

TATAPOWER | Buy @LTP with SL below 370 | 1st Target 413Disclaimer:
This is not financial advice. Please do your own research or consult with a financial advisor before making any investment decisions. Investments in stocks can be risky and may result in loss of capital.

Summer= More Energy demand With the summer coming and ends into more consumption of energy,
Energy sector being in green today and stock which has performed well in past during this season.
Breakout of this zone can give target upto 10%

TATA Power CMP 357, Bearish 23.02.2025Tata Power looks weak at current level, TGT of 330 can be seen in 1-2 days
only for information and education purpose

Tata Power in Demand ZoneA demand zone is an area where buyers have previously stepped in aggressively, leading to strong price reversals. It is identified by looking at past price action, not indicators.
1. Identifying Tata Power's Demand Zone
Strong Buying Area: Look for a historical price level where the stock has reversed multiple times.
Sharp Rally After Base: If price consolidated at a level before making a strong upward move, it signals a demand zone.
Large Bullish Candles: Areas where price moved up quickly and strongly indicate institutional buying.
2. Entry Confirmation in the Demand Zone
Once Tata Power reaches the demand zone, wait for price action confirmation before entering:
✅ Price Slowing Down:
If the stock was in a downtrend but starts making small-bodied candles (dojis, inside bars), it indicates selling exhaustion.
✅ Rejection Wicks (Long Tails):
If the price enters the demand zone and forms candles with long lower wicks, it means buyers are absorbing sell orders.

Review and plan for 5th February 2025Nifty future and banknifty future analysis and intraday plan.
Results.
This video is for information/education purpose only. you are 100% responsible for any actions you take by reading/viewing this post.
please consult your financial advisor before taking any action.
----Vinaykumar hiremath, CMT

$NSE:TATAPOWER SHORTNSE:TATAPOWER
1.First pullback since the breakdown
2. M pattern at the retesting
Good RR if trigger above the PD low

TATA POWER CO LTD S/R Support and Resistance Levels:
Support Levels: These are price points (green line/shade) where a downward trend may be halted due to a concentration of buying interest. Imagine them as a safety net where buyers step in, preventing further decline.
Resistance Levels: Conversely, resistance levels (red line/shade) are where upward trends might stall due to increased selling interest. They act like a ceiling where sellers come in to push prices down.
Breakouts:
Bullish Breakout: When the price moves above resistance, it often indicates strong buying interest and the potential for a continued uptrend. Traders may view this as a signal to buy or hold.
Bearish Breakout: When the price falls below support, it can signal strong selling interest and the potential for a continued downtrend. Traders might see this as a cue to sell or avoid buying.
MA Ribbon (EMA 20, EMA 50, EMA 100, EMA 200) :
Above EMA: If the stock price is above the EMA, it suggests a potential uptrend or bullish momentum.
Below EMA: If the stock price is below the EMA, it indicates a potential downtrend or bearish momentum.
Trendline: A trendline is a straight line drawn on a chart to represent the general direction of a data point set.
Uptrend Line: Drawn by connecting the lows in an upward trend. Indicates that the price is moving higher over time. Acts as a support level, where prices tend to bounce upward.
Downtrend Line: Drawn by connecting the highs in a downward trend. Indicates that the price is moving lower over time. It acts as a resistance level, where prices tend to drop.
Disclaimer:
I am not a SEBI registered. The information provided here is for learning purposes only and should not be interpreted as financial advice. Consider the broader market context and consult with a qualified financial advisor before making investment decisions.

TATA POWER swing Reversal from supportforming inside bar at support & even RSI is below 30
swing trade
looks good R:R
entry 385
SL 374
TG1 400
TG 408

Tata Power has possibility to correct till 300Tata Power has formed "Bearish Wolfe wave - Three drive pattern"
This has potential to bring down tata power to following targets.
360 - 335 - 300

Tata Power 05.01.2025 Tata power looking weak, if break 390 Again, Short position will initiate, first Target 370 in 1 month, second 330

Tata power, good buy for long term and short term Tata power one of the best best fundamental stock now available at good demand zone one can add in portfolio if not added yet
Can add at levels of 380-405
Sl mclbs 365
Tgt atleast:1:2 & 25% to 100% expecting a blast before a Indian budget
Ask your financial advisor and broker before buying
Only for educational purposes

Tata Power at Make-or-Break Levels Near ₹400
Tata Power is currently trading around ₹400, a pivotal zone on the weekly chart. This level serves as a critical inflection point, with significant implications for the stock’s medium-term trajectory.
Key Observations:
Support Levels:
Immediate support lies at ₹340-350, a previously tested zone.
A breach below this could push the stock toward ₹275, the next strong support.
Resistance Levels:
Immediate resistance is seen at ₹420-430. A breakout above this zone may open doors for a rally toward ₹480-500.
Scenarios to Watch:
Bullish Case:
Sustained momentum above ₹420 with high volume can confirm an uptrend, targeting ₹480 and beyond.
RSI nearing a neutral or bullish zone (~50-60) supports this case.
Bearish Case:
A breakdown below ₹340 might trigger a sell-off, with lower targets at ₹275 and ₹225.
Trading Plan:
Monitor price action and volume near ₹400. Breakout traders can aim for ₹480+ if resistance is breached, while cautious traders should wait for confirmation at support levels.
#TataPower #TechnicalAnalysis #TradingIdeas

TATAPOWER SHORT TERM ANALYSIS Tata Power appears to be exhibiting bullish momentum, with the potential to reach a short-term peak of 450-470. However, a breach of 380 would invalidate the bullish view and signal a potential downside.

TATA Power Buyfundamentally Tata Power under value is 397 alrdy active 100-200 point trgt bcz its large cap

TATAPOWERNSE:TATAPOWER
One Can enter now!
Or Wait for a retest of the trendline(BO)!
Or Wait for a better Risk:Reward Ratio!
Note :
1. One should go long with a StopLoss, below the Trendline or the Previous Swing Low.
2. Risk :Reward ratio should be minimum 1:2.
3. Plan your trade as per the Money Mangement and Risk Appetite.
Disclamier : You are responsible for your profits and loss.
The idea shared here is purely for Educational purpose.
Follow back, for more ideas and thier notifications on your email.
Support and Like incase the idea works for you.

TATAPOWER Trading within tested Demand Zone of ₹419.15 to ₹411.3TATAPOWER's current price is ₹417.7, positioning it within a demand zone between ₹419.15 and ₹411.3. This zone is tested, and may act as a support level. Investors should keep an eye on the stock's performance in this range, looking for signs of a potential price bounce or consolidation, which could indicate a favorable buying opportunity.

TATAPOWERTATAPOWER
daily timeframe
i just shared my experience it is not an invite or recommendation to trade.
if youn any doubt means Please leave comments for any query.
best wishes
DYSON

Tata Power Co. Ltd. - Technical OverviewTarget Price: ₹560 (As per Nomura's analysis)
Price Action: The stock is currently trading at ₹456.90 (+3.54% for the day). It has been in a steady uptrend, following a clear rising channel since early 2024, supported by both the 50-day and 200-day moving averages, which indicates long-term bullish momentum.
Key Levels:
Support: ₹435.50 (currently a strong support level near the lower trendline)
Resistance: ₹507.40 (the recent upper boundary of the trend channel)
Target Price : ₹560 (suggested by Nomura)
Trend Channels:
The stock has formed a well-defined ascending channel , where the price tends to respect both the upper and lower boundaries.
Recent pullbacks toward ₹435.50 suggest that the stock is consolidating before a potential bounce toward ₹507.40, and possibly ₹560 in the medium term.
Price Momentum:
RSI: The Relative Strength Index (RSI) suggests that the stock is not in overbought or oversold territory, signaling healthy price momentum.
Volume : Notice the spike in volume during price rallies, reflecting strong market interest and confirmation of price movements.
Outlook:
Given the current market setup, Tata Power is showing signs of continued bullish momentum within its trend channel. A move beyond ₹507.40 could trigger further buying, pushing the stock towards ₹560 in the medium term. Any price retracements to the ₹435 level can be seen as a potential buying opportunity, given the channel support.
Chart Details:
Green Lines : Support and resistance levels.
Blue Channels : The stock’s rising trend, representing medium-term bullish momentum.
Volume: Key volume spikes highlight investor activity during price jumps.

Tata Power LongTata Power
MTF Analysis
Tata PowerYearly Demand 298
Tata Power 6 Month Demand BUFL 298
Tata PowerQtrly Demand Breakout 350
Tata PowerMonthly Demand 433
Tata PowerWeekly Demand 451
Tata PowerWeekly Demand 451
ENTRY -1 451
SL 430
RISK 21
Potential Target 565
First Target Points 535
First recovery Target Points 105
Last Swing Low 355
Last Swing High 460
RR 5
RR 25%

TATA POWER BUY TATA POWER UPTREND
Trade Reason:
1) Weekly Take Strong Support
2) 4 Hour - Trend Reversal
3) Pattern Formation - Harmonic Pattern Activated .
Entry - 431 Rs
Stoploss - 403 Rs
Target - 460 Rs
Happy Trading ...

52 Week High Breakout - Positional Trade - Long TermDisclaimer: I am not a Sebi registered adviser.
This Idea is publish purely for educational purpose only before investing in any stocks please take advise from your financial adviser.
52 Week Breakout. Stock has Crossed 52 week High. Keep in watch list. Buy above the high. Suitable for Positional Trade. Stop loss & Target Shown on Chart. Stop loss Trail by 30 SMA. Exit if Price Close below 30 SMA on Weekly Chart.
Be Discipline because discipline is the Key to Success in the STOCK Market.
Trade What you see not what you Think.
