Bullish Symmetrical Triangle pattern in TataSteelBullish Symmetrical Triangle pattern formed in TATASTEEL. In a few days or week, the share price will suddenly start rising.
TATASTEEL trade ideas

Bullish Symmetrical Triangle pattern formed in TataSteelBullish Symmetrical Triangle pattern formed in TATASTEEL. In a few days or weeks, the share price will suddenly start rising.

TATA STEEL PREDICTIONS 28 OCTNeutral thoughts 1340-1350 heavy resistance. Long-term bullish trend but declining steel prices may bring it down.

Tata steel on a crucial levelTata steel on its make or break level..wait for a bullish momentum tomorrow then one can think of going long on tata steel for swing

Tata steel ready for breakout Tata steel at its important support. Keep looking out for the breaking of that trend line .will show some good moves

TATA steel looking very powerfulTATA steel looking very powerful may be a good bullrun for this stock.
very heavy support on weekly

Tata steel looks good above 1400 levelsTatasteel given breakout and looks like its retesting the levels after a green candle above trendline one can go long..
.
.
.
.
.
It is just for educational purpose

Tata Steel 4hr Chart Symmetrical Triangle 20 Oct 2021Tata Steel on 4hr Chart Formed Symmetrical Triangle 20 Oct 2021. Breakout Didn't sustain. Wait for breakout and Retest. 20 Oct 2021.

Greate opportunity in Tata steels.So here is the 1 day chart of Tata Steel ,as you all can see it creates a head and shoulders pattern and give a breakdown, now it is coming back for retest.
So in this case we have two opportunities
1- if it breakout the neckline and crosses it the next target would be 1470 which is its previous shoulder and if it even breakout shoulder the next Target is 1530 which is head.
2- the second possibility is that if it can't cross the neckline and reverse back than this is the sign of selling pressure and for this scenario we have target of 1250.
From my observation there are higher chances of downtrend,but we have to aware of both opportunities
🙏🏿
Thanks and regards
Ankit Mathela
Keep trading 🔥

Tata Steel looking goodNSE:TATASTEEL
Important levels marked on the chart.
This is my personal view and not recommendation.

Tata Steel ready to moveDisclaimer:
All information shared is just for educational purposes.
By no means shall we be accountable for any debits/losses amounting out of it.
We are not SEBI registered Analysts, so please consult your Investment Advisor and take rational decisions.

TATASTEEL 1hr Wait For a Breakout and Take Trade ! if blue line is broken below or above take trades accordingly !

Short with Risk of 1% and RR of 1:2Short with Risk of 1% and RR of 1:2
"
NOTE: You should not engage in trading unless you fully understand the nature of the transactions you are entering into and the extent of your exposure to loss. If you do not fully understand these risks you must seek independent advice from your financial advisor. All trading strategies are used at your own risk."

Tata Steel 1hour Ascending Triangle Breakout 13 Oct 2021Tata Steel 1hour chart Ascending Triangle pattern made a Breakout 13 Oct 2021. Watch out for Fakeout / Retest.

TATA STEEL INTRADAY...NSE:TATASTEEL
TO ANALYSIS STOCKS FOR INTRADAY-
1- switch to higher time frame and analysis the trend which market is currently following
2- also candelstick pattern are effective in higher time so look for any of that( inside bar , doji , engulfing etc)
3- then switch to your trading time frame and then trade in that
Please note that we are not a SEBI Registered Investor Adviser/PMS/ Broking House.
All the contents over here are for educational purposes only and are not investment advice or recommendations
offered to any person(s) with respect to the purchase or sale of the stocks / futures and options.
You are also requested to apply your prudence and consult your advisers in case you choose to act on
any such content available as WE claims no responsibilities for any of your actions or any outcome of
such action

Tata SteelTata Steel look weaker on Daily Time Frame.
It has broken trendline which started from price 500 to price 1500.
Also it has fallen down to 1270. Support was 1300.
Support is broken.
Now Trading 1307. Down move expected to 1050 price Soon.

Tata Steel 15min chart Ascending Triangle 10 Oct 2021Tata Steel 15min chart forming Ascending Triangle 10 Oct 2021. Watch out for breakout.

TATA Steel sell for day tradeTATA Steel breaks down trendline if the bear market continue for stock then we will short TATA steel for day trade

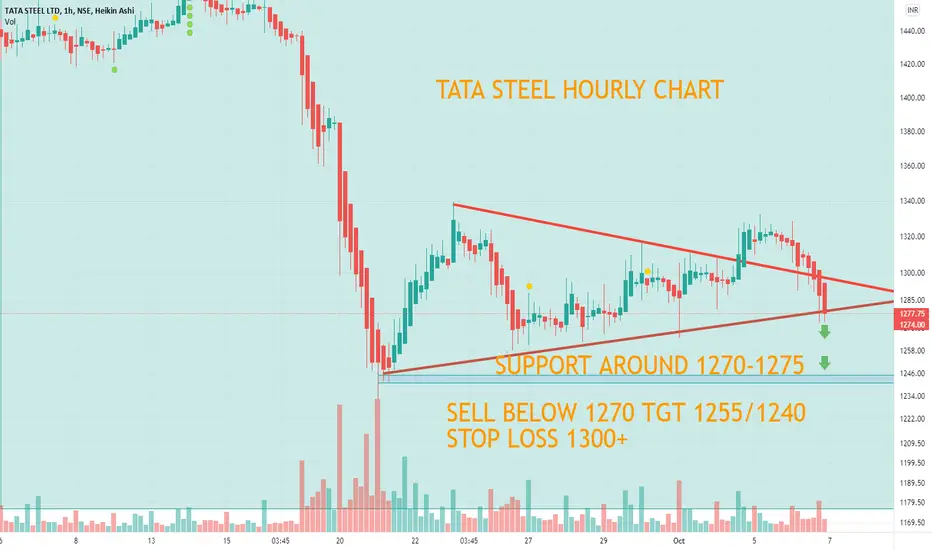
TATA STEEL HOURLY CHART Trading at imp support , it is week below 1270 , tgt 1255/1240 in intraday . negate if closed above 1300-1305

TATA SteelTATA Steel - Sell
Weak on charts
RSI - 36.51 - towards the oversold zone
Below 50 MA
My Suggestion : Enter only once it moves above 1400 levels & goes above the 50 MA

Tatasteel looks good above 1455 range with strict slTatasteel looks good above 1455 range but RSI is oppsosit on chart please take position only after analysing your risk or can trade fr intraday it can give good move but if it is able to close above al cluster then for sure we can see new ATH

TATASTEEL Keep an eye on this pattern formed in #TATASTEEL
can give a good breakout
on the either side of the pattern
can book 1:2 RR
