Tata Steel - End of Wave 3 - Ready for a quick correction?Tata steel has had a stellar runaway in the past 3 months. Considering the march lows of 240() and recent highs of 640().
I prefer to use 3 hour time frames to understand the broader trend of the stock. It seems that TATA STEEL is preparing for its corrective wave 4 for the time being. Wave 4 at max corrects till 38.2 % fib levels. Considering the September lows of 340 and recent highs of 640, the possible levels comes down to 570 and 520.
Wave 4 usually corrects with the price or with time. 520 seems to be an interesting price to accumulate the same for the long term investments.
Wave 5 is pending :)
TATASTEEL trade ideas


TATASTEEL - WEAK METAL?Metals have been out of flavor in today's down move along with host of others like AUTO. The break-down compels one to question the excessive up move and calls for deeper correction. CNXMETAL depicts similar picture. TATASTEEL caps 625 for move to 540 one attempt. Immediate support at 590 is under threat. Below 627 eyes these lows. Some profit taking around 550-560 in order during the decent.

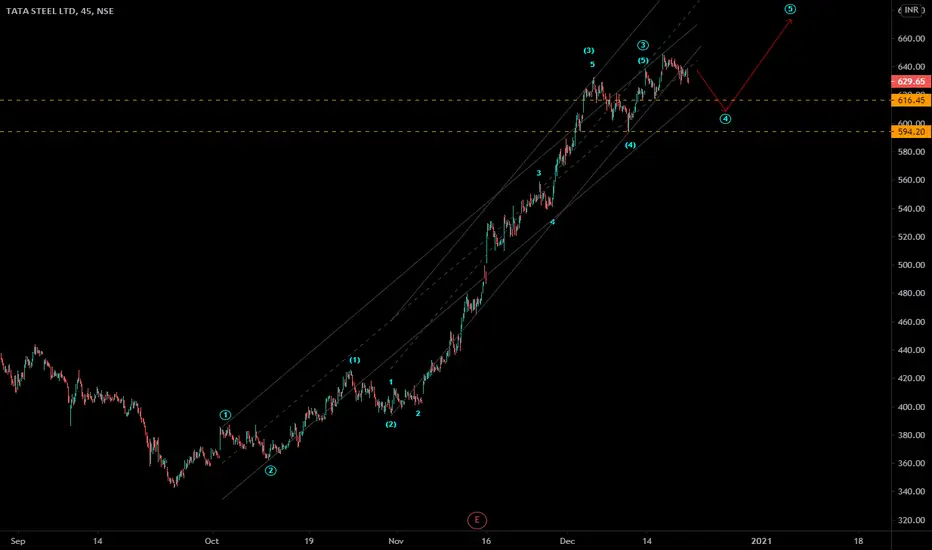
TATASTEEL - Elliott wave analysis - correction then buy Tatasteel is in 4th wave correction and may finishes near 616-595 zone. Go long in that zone for next up cycle for target above 660.
Short Tata Steel below supportTata steel is in bearish trend in weekly timeframe and can be shorted below support


Tata Steel - Cup and Handle PatternTata Steel - Cup and Handle pattern and trying to cross near resistance. Can quickly shoot up

Tatasteel UpdateAfter break out tatasteel gone mad. But here it's come to first resistance area. 625.15 to 647.6 and RSI near to 80. Get ready to profit booking in upcoming weeks.


Trend change Prices are increasing in TATA Steel but volumes are decreasing , shows a possible signal of trend change . RSI shows wide divergence which also confirms the trend change . A resistance at 550 .
Sell for a profit target of 540/++ with a stop at 552.

TATA STEELTATA STEEL
CMP 492
The Giant is heading for a very strong resistance zone 506-518 if able to break can do wonders
Support lies at 440
keep watch
(entry exit as per ur R:R)

TataSteel Long Term viewTata Steel Ltd given Falling Wedge Break Out.. Targets Mentioned on chart.. its a long term view approx 2 to 3 year..

