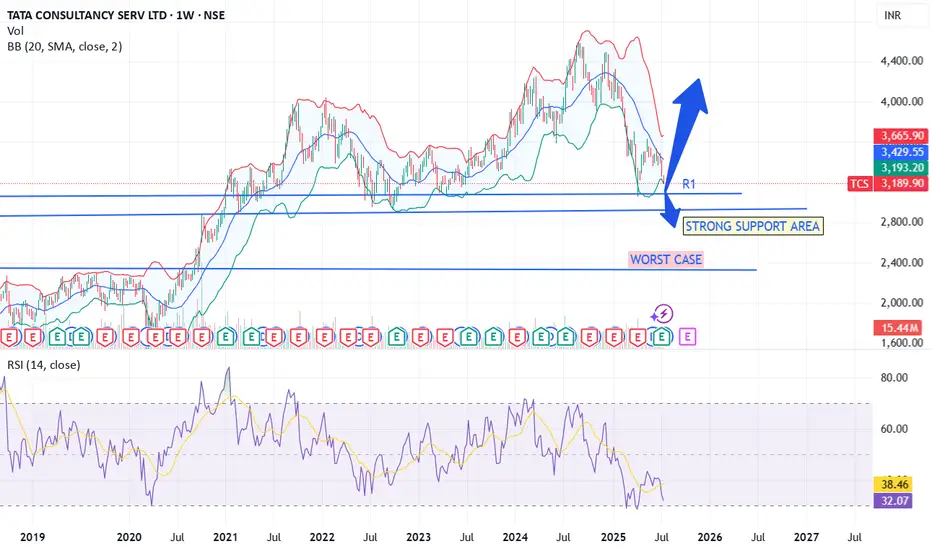
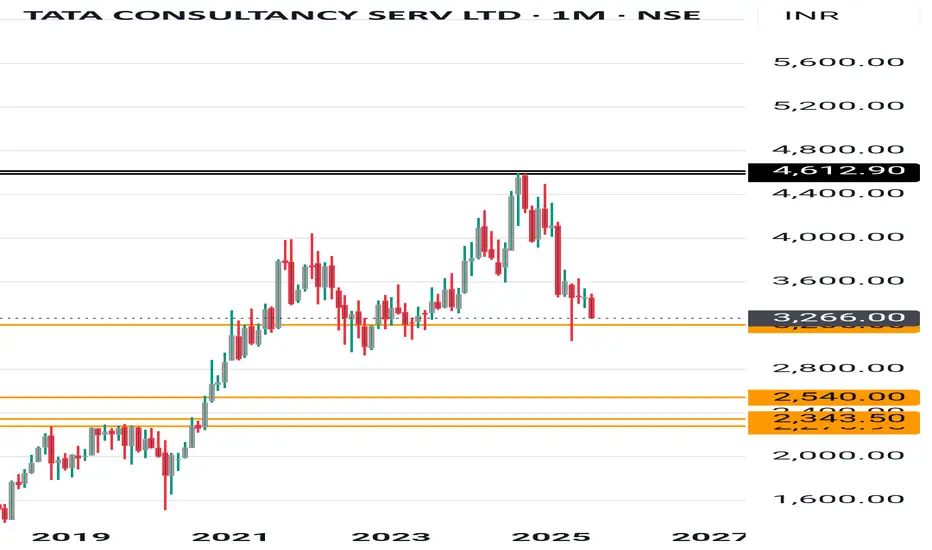
3000 to hold else we are going more down, target 3400-3700📝 Recent Performance
Q1 FY26
Net profit: ₹12,760 crore (↑6% YoY) .
Revenue: ₹63,437 crore (↓2.2% YoY), third consecutive quarterly decline .
Margins remained solid (~24%) .
Stock Momentum
Broke below key technical support post-Q1; could drop another ~5% .
2025 is the worst-performing sector—IT
Next report date
—
Report period
—
EPS estimate
—
Revenue estimate
—
136.20 INR
485.53 B INR
2.55 T INR
1.02 B
About TATA CONSULTANCY SERV LTD
Sector
Industry
CEO
Kunchitham Krithivasan
Website
Headquarters
Mumbai
Founded
1968
ISIN
INE467B01029
FIGI
BBG000Q0WGC6
Tata Consultancy Services Limited (TCS) is engaged in providing information technology (IT) services, digital and business solutions. The Company's segments include banking, finance and insurance services (BFSI); manufacturing; retail and consumer packaged goods (CPG); telecom, media and entertainment, and others, such as energy, resources and utilities, hi-tech, life science and healthcare, s-Governance, travel, transportation and hospitality, and other products. Its services portfolio consists of IT and assurance services, business intelligence and performance management, business process services, cloud services, connected marketing solutions, consulting, engineering and industrial services, enterprise solutions, IT infrastructure services, mobility products and services and platform solutions. Its software offerings include Digital Software and Solutions, TCS BaNCS and TCS MasterCraft, among others. It serves industries, including insurance, healthcare, retail, telecom and others.
Related stocks
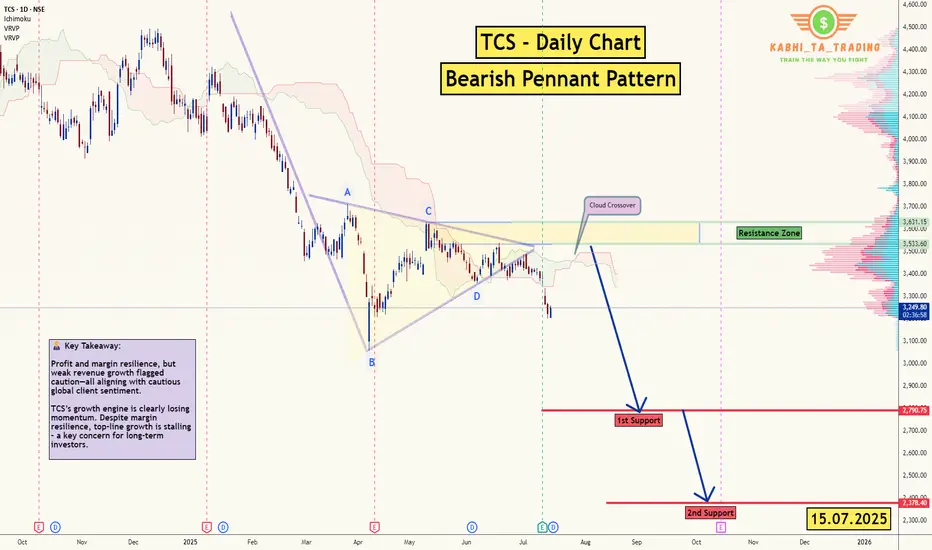
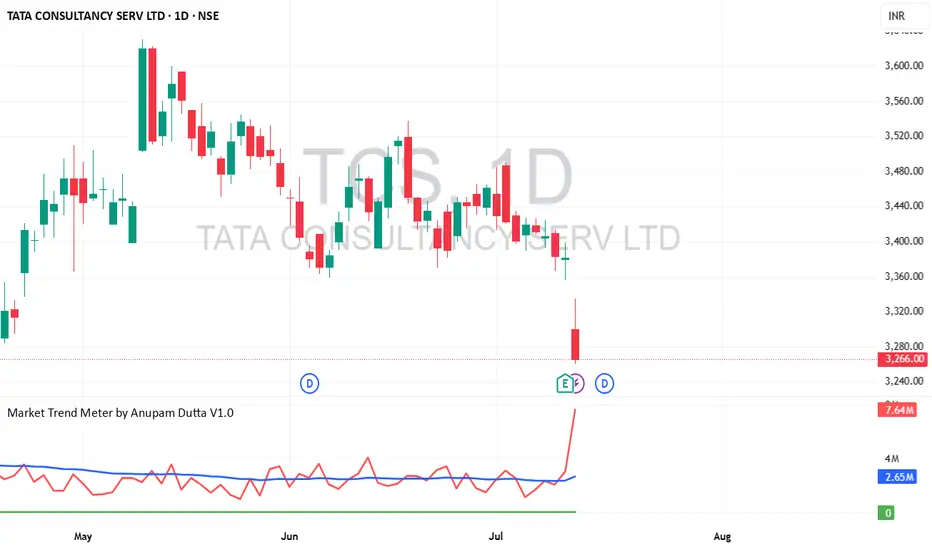
TCS - D1 - Bearish Pennant 🧾 1. 📊 Q1 FY26 Earnings Summary
i. Revenue: ₹63,437 cr (~US $7.4 bn), up just 1.3% YoY, missing expectations of ~₹64,667 cr
ii. Profit/margin held up; revenue disappointed.
📌 Key Takeaway: Profit and margin resilience, but weak revenue growth flagged caution—all aligning with cautious
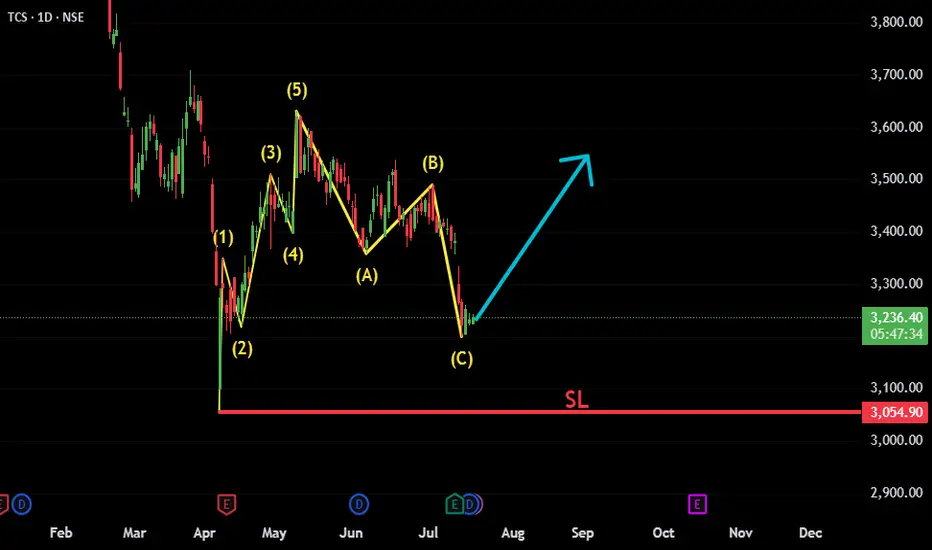
TCS: ABC Correction Complete – New Impulse Wave in FocusTCS appears to have completed a classic Elliott Wave structure, consisting of an initial 5-wave impulsive move followed by an A-B-C corrective phase. The recent price action suggests the correction has likely ended, and a new bullish impulsive move is beginning.
Fundamental trigger:
Interestingly,
At demand areaIn stock trading, a demand area, or demand zone, refers to a price range where buying interest is strong, potentially leading to a price increase or a price bounce. It's essentially a "buying hotspot" where buyers are actively purchasing, pushing the price upward
TCS Long Opportunity - Medium-Term Swing Trade📈 TCS Long Opportunity – Medium-Term Swing Trade
🔹 Entry : ₹3266 (Last Close)
🔹 Target : ₹3525
🔹 Qty : Up to 25 shares
🔹 Timeframe : ~6 months
🔹 Estimated ROI : ~16.49% annualized
A moderate-risk swing setup on Tata Consultancy Services . Technically and fundamentally aligned for
TCS Short_Rejection From 20 & 50 Daily EMATCS Short:
- Rejection from 20/ 50 Daily EMA
- Bearish Engulfing Candle
- Enter when the prices are favorable in lower time frame.
- SL: Today's High or close above 20/ 50 Daily EMA

Technical Trend Analysis of Tata Consultancy Services (TCS) Tata Consultancy Services (TCS), a leading player in the IT services sector, has recently garnered attention for its potential volume increase, making it a focal point for technical analysis.
This blog post delves into the current technical trend analysis of TCS stock (NSE: TCS) based on the 1-day

TCS_Neutral_Waiting for signal- Price near Resistance
- Below 50 DEMA (which was key Resistance for sometime now)
- No opinion as of now
- Will decide about the direction once price breaks today's range

TCS Head and ShoulderTCS is forming H&S pattern for bullish momentum.
If this breakout happens a good momentum will be seen above 4100.

See all ideas
Summarizing what the indicators are suggesting.
Neutral
SellBuy
Strong sellStrong buy
Strong sellSellNeutralBuyStrong buy
Neutral
SellBuy
Strong sellStrong buy
Strong sellSellNeutralBuyStrong buy
Neutral
SellBuy
Strong sellStrong buy
Strong sellSellNeutralBuyStrong buy
An aggregate view of professional's ratings.
Neutral
SellBuy
Strong sellStrong buy
Strong sellSellNeutralBuyStrong buy
Neutral
SellBuy
Strong sellStrong buy
Strong sellSellNeutralBuyStrong buy
Neutral
SellBuy
Strong sellStrong buy
Strong sellSellNeutralBuyStrong buy
Displays a symbol's price movements over previous years to identify recurring trends.
Curated watchlists where TCS is featured.

Indian stocks: Racing ahead
46 No. of Symbols
See all sparks
Frequently Asked Questions
The current price of TCS is 3,135.80 INR — it has decreased by −0.39% in the past 24 hours. Watch TATA CONSULTANCY SERV LTD stock price performance more closely on the chart.
Depending on the exchange, the stock ticker may vary. For instance, on NSE exchange TATA CONSULTANCY SERV LTD stocks are traded under the ticker TCS.
TCS stock has fallen by −2.77% compared to the previous week, the month change is a −7.97% fall, over the last year TATA CONSULTANCY SERV LTD has showed a −26.99% decrease.
We've gathered analysts' opinions on TATA CONSULTANCY SERV LTD future price: according to them, TCS price has a max estimate of 4,610.00 INR and a min estimate of 2,702.00 INR. Watch TCS chart and read a more detailed TATA CONSULTANCY SERV LTD stock forecast: see what analysts think of TATA CONSULTANCY SERV LTD and suggest that you do with its stocks.
TCS stock is 1.00% volatile and has beta coefficient of 0.83. Track TATA CONSULTANCY SERV LTD stock price on the chart and check out the list of the most volatile stocks — is TATA CONSULTANCY SERV LTD there?
Today TATA CONSULTANCY SERV LTD has the market capitalization of 11.34 T, it has decreased by −4.43% over the last week.
Yes, you can track TATA CONSULTANCY SERV LTD financials in yearly and quarterly reports right on TradingView.
TATA CONSULTANCY SERV LTD is going to release the next earnings report on Oct 15, 2025. Keep track of upcoming events with our Earnings Calendar.
TCS earnings for the last quarter are 35.27 INR per share, whereas the estimation was 33.97 INR resulting in a 3.83% surprise. The estimated earnings for the next quarter are 34.40 INR per share. See more details about TATA CONSULTANCY SERV LTD earnings.
TATA CONSULTANCY SERV LTD revenue for the last quarter amounts to 634.37 B INR, despite the estimated figure of 646.88 B INR. In the next quarter, revenue is expected to reach 648.84 B INR.
TCS net income for the last quarter is 127.60 B INR, while the quarter before that showed 122.24 B INR of net income which accounts for 4.38% change. Track more TATA CONSULTANCY SERV LTD financial stats to get the full picture.
TATA CONSULTANCY SERV LTD dividend yield was 1.66% in 2024, and payout ratio reached 44.71%. The year before the numbers were 1.42% and 43.69% correspondingly. See high-dividend stocks and find more opportunities for your portfolio.
As of Jul 26, 2025, the company has 607.98 K employees. See our rating of the largest employees — is TATA CONSULTANCY SERV LTD on this list?
EBITDA measures a company's operating performance, its growth signifies an improvement in the efficiency of a company. TATA CONSULTANCY SERV LTD EBITDA is 676.20 B INR, and current EBITDA margin is 26.49%. See more stats in TATA CONSULTANCY SERV LTD financial statements.
Like other stocks, TCS shares are traded on stock exchanges, e.g. Nasdaq, Nyse, Euronext, and the easiest way to buy them is through an online stock broker. To do this, you need to open an account and follow a broker's procedures, then start trading. You can trade TATA CONSULTANCY SERV LTD stock right from TradingView charts — choose your broker and connect to your account.
Investing in stocks requires a comprehensive research: you should carefully study all the available data, e.g. company's financials, related news, and its technical analysis. So TATA CONSULTANCY SERV LTD technincal analysis shows the sell today, and its 1 week rating is strong sell. Since market conditions are prone to changes, it's worth looking a bit further into the future — according to the 1 month rating TATA CONSULTANCY SERV LTD stock shows the sell signal. See more of TATA CONSULTANCY SERV LTD technicals for a more comprehensive analysis.
If you're still not sure, try looking for inspiration in our curated watchlists.
If you're still not sure, try looking for inspiration in our curated watchlists.