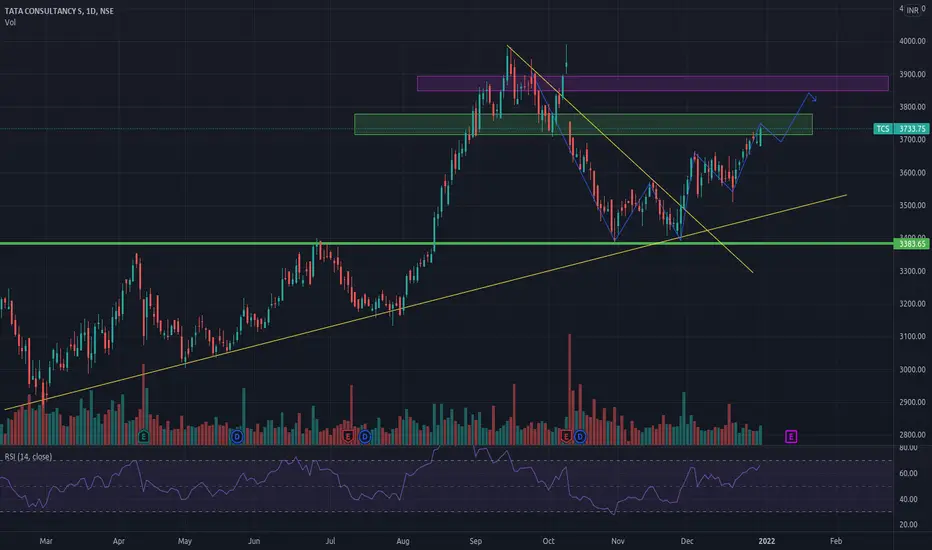
TCS Buy -Long Term Bullish Channel, at key support levels nowTCS has been in long term bullish channel for few years now and has been moving within the parallel channel for a while. Right now it's consolidating at the lower end of the channel and might test key support levels at the lower channel trend line and 3385 levels. Long term investors can start accumulating at these levels even if there's a slight risk of pull back. TCS will hit the all time high above 4000 by Jan 2022 with stronger quarterly results.
TCS trade ideas

Retest Support at previous Resistance done ?Retesting the level at previous resistance.
We can see rally to new high, if reaches the previous high levels.

TCS intraday long tradeAn obvious flag and pole pattern in TCS on 15 mint time frame.
On breakout it can give a minimum target of 4050
Buy onlu after a breakout and carry the position if it closes above 4053 on daily basis.

Rounding bottom on daily time frame, Target 4500 next 6 month...Excellent rounding bottom form on daily time frame, Target 4500 in next 6 month

TCS New Record high Possibilty- 4216TCS - now tcs price is 3998 so if break 4000 level so new high possibility in tcs -4216.

TCS Rounding Bottom in TCS
Good rally in TCS as per our Prediction
Now either Breakout or Breakdown
Breakout above 3990 if sustained
Lots of positive new about the Stock
Stock is in Good Uptrend
But we will play as per the charts
If Breakout Buy - May Rise
If Breakdown Sell - May Fall (Don't negate the fall side)
If Breakout Fails be ready for a Quick downside selling profit
Buy above 3990
TGT 4500
SL 3915
Sell below 3930
TGT 3800 - 3725
SL 3995
Please do correlate by yourself also on charts. This is for paper trading and educational purpose only. Must consult your Financial advisor before investing.

TCS IndiaSun Storm Investment Trading Desk & NexGen Wealth Management Service Present's: SSITD & NexGen Portfolio of the Week Series
Focus: Worldwide
By Sun Storm Investment Research & NexGen Wealth Management Service
A Profit & Solutions Strategy & Research
Trading | Investment | Stocks | ETF | Mutual Funds | Crypto | Bonds | Options | Dividend | Futures |
USA | Canada | UK | Germany | France | Italy | Rest of Europe | Mexico | India
Disclaimer: Sun Storm Investment and NexGen are not registered financial advisors, so please do your own research before trading & investing anything. This is information is for only research purposes not for actual trading & investing decision.
#debadipb #profitsolutions

TCS - Pullback completed - Ready to Go upObservations:
1. Formed Triangle pattern (in this year 2021) - Support is raising with the same level of Resistance - indication to go up shortly
2. Went up shortly and pulled back to same resistance level (now turned to support) - 2nd confirmation to go up
3. Targets are specified in the charts above.
Note:
I'm not recommending buying this stock. This is for education purposes.
Please invest after careful research. I'm not responsible for your profits/losses.
- Gnanasekaran

Trade Cup and Handle PatternsRecognizing Cup and Handle Patterns
When evaluating whether a cup and handle pattern is real, it is important to look at the shapes of both the cup and the handle.
The cup should be more U-shaped than V-shaped, as a gentle pullback from the high is more indicative of consolidation than a sharp reversal. The U-shape also demonstrates that there is strong support at the base of the cup and the cup depth should retrace less than 1/3 of the advance prior to the consolidation pullback. However, cup depths between 1/3 to ½ the level of the prior advance are possible in volatile markets, and even cup depths retracing 2/3 of the prior advance are possible in extreme setups. The cup can develop over a period of one to six months on daily charts, or even longer on weekly charts. Ideally, the highs on the left and right side of the cup are at roughly the same price level, corresponding to a single resistance level.

TCS Trade Setup:
Daily: inverted hammer, indicating buying intention. The volumes are high, which means accumulation at lower levels. As a confluence, the stock is at bottom of channel pattern & strong support level (pink zone).
Entry = CMP ie, approx. 3397 INR
SL = below 200 EMA or support level at approx. 3300 INR
Target = 3700 INE (Next resistance zone)
RR = 1: 2.8 (highly favorable)
Note: on monthly time frame, the stock has exhibited 'evening star' (bearish) pattern. So, be cautious for long term buying.

BUY TCS AROUND 3380-3400 AVG @ 3315 TGT 3600/3900/4300 SL 3175 After missing the estimates in the second quarter, it took a healthy correction of almost 18% from the high and currently very near to 200DMA point which will be acting as a support for the stock, It is a high time for adding the stock in the portfolio after such a healthy correction for the above mentioned target with given stop loss.

TCS 15-11-21A buy for the long term. After a big gap-down , the stock tested its crucial support levels of 3400. It has taken the support and now is gearing up for another big move. As per analysis we can Expect 10-12% returns in a span of 2-3 months. Targets , Entry level and stop loss are marked on the chart. As the markets are in consolidation phase , trade accordingly.
CMP : 3520
PS : For educational purposes only.

TCS Jan 2nd week #tade 1.3
if the price trace green line buy at the arrow mark and take profit at indicated lines, boom..!
if the price trace blue line buy at the arrow mark and take profits at indicated lines, boom..!
if it goes to stop loss, the trade is successful failed :)
I dnt hv the patience to explain
Not a advisor, trade at ur own risk
happy trading :)


TCS break minor trend and look like impulse move on bullishTcs Break minor trend and it also retrace 23% and return in febanoci

TCS - Stock to watch out TCS is almost on the verge of breaking its ATH. One can go long after it breaks its ATH. Please add this stock to your watchlist.
DISCLAIMER: The ideas are only for educational purposes and not buy/sell recommendation. I am NOT SEBI registered.

TCS India Sun Storm Investment Trading Desk & NexGen Wealth Management Service Present's: SSITD & NexGen Portfolio of the Week Series
Focus: Worldwide
By Sun Storm Investment Research & NexGen Wealth Management Service
A Profit & Solutions Strategy & Research
Trading | Investment | Stocks | ETF | Mutual Funds | Crypto | Bonds | Options | Dividend | Futures |
USA | Canada | UK | Germany | France | Italy | Rest of Europe | Mexico | India
Disclaimer: Sun Storm Investment and NexGen are not registered financial advisors, so please do your own research before trading & investing anything. This is information is for only research purposes not for actual trading & investing decision.
#debadipb #profitsolutions

TCS - Price Action Analysis NSE:TCS is soon to Fill-up their gap but there is a plot.
As you can see the previous day was created as shooting star candle which indicate sellers would not allow to go price further and also you can see it has touched 61.8% of Fibonacci level at 3757. So both scenario strongly says that price could take reversal.
But any Gap up above 3557 leads price up to 3800 and any gap down below previous day candle leads price to 3615.
BUY : Buy above 3557 or wait till if price corrects up to S1 (3614-3641)
SELL : short trade might not recommended but if any support breaks you can take it or you can play reversal at resistance after confirmation candle occurs.

TCS chart analysis TCS chart analysis
This is my study on TCS, We will see resistance in 3700 to 3760
possibly the upper will break and after breaking 3760 targets of 3850 is not away.
TCS double W formationTCS need to fill the gap but for now it will downtrend and will rise after given entry

TCS Is Looking Good For SwingWhat we believe in :-
°Trade With Logic
°Take Time Before Investment
Saving Your Capital 🙂
I'm not responsible for your profit or loss.
Mainly Stock & Crypto Investor 🕵️
| Interim Trader 📊
DISCLAIMER :- This Channel Is For ( EDUCATIONAL PURPOSES )


Solid Breakout In Tcs IT sector has given the breakout and some of the stocks have given breakout TCS is still left can have big targets, atleast it's very good for intraday.
Long above 3640
Targets 3660/3680/3700
Stoploss 3630
