TCS trade ideas

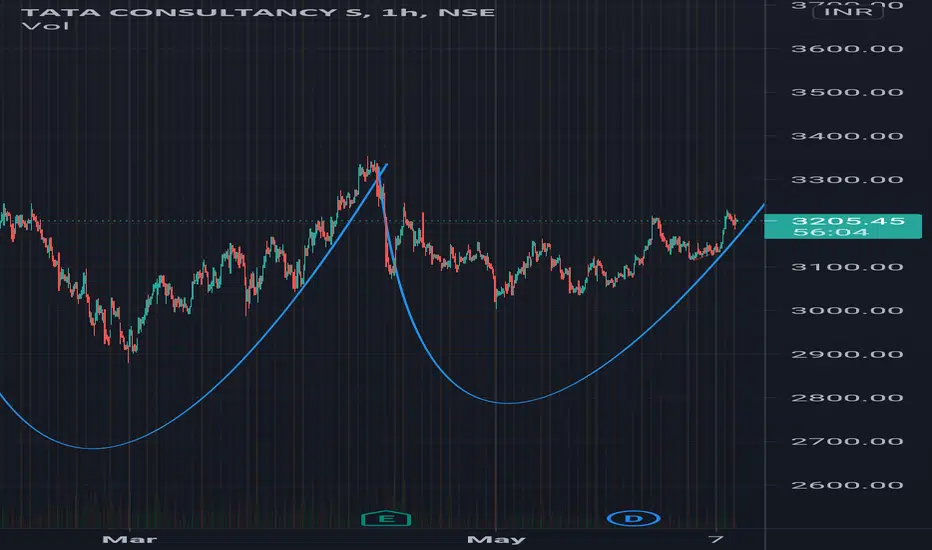
TCS trading ideasTCS sell from CMP and sl 3358 trgt 3100 there's a supply zone I see fall can seen till 3100 then again it'll move up by curve swing.
Tcs is always a market MAMMOTH.....Tcs has huge upside... it is always a Market MAMMOTH.. Has upside of 4600.. NOW JUS AT 3280..
THATS NEARLY 40% UPSIDE .. & More over great dividends also..

TCSTCS is follow this lines
When it's cross 3290 then Target is 3350
And hear stoploss is 3265
it's follw falg Pattan when it's brack then boom 🔥

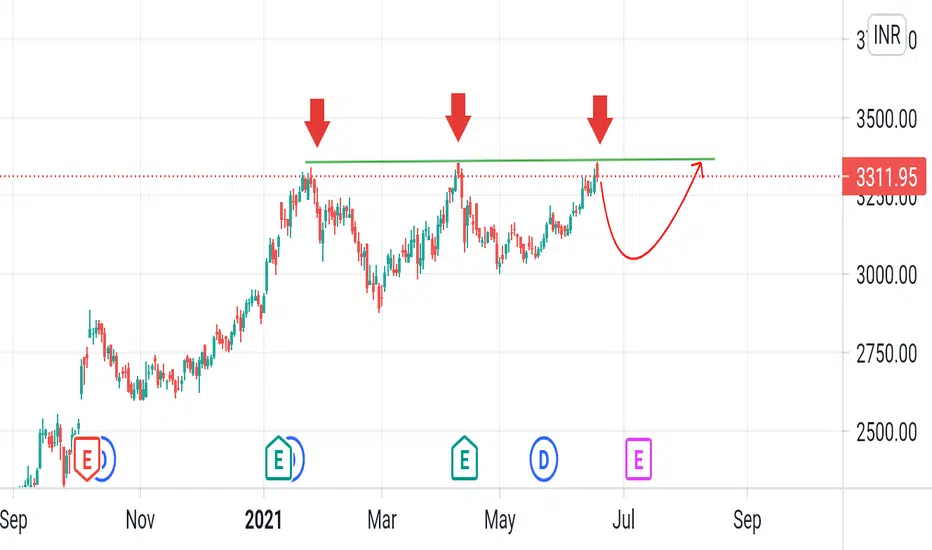
Pattern formation in TCSNSE:TCS
*Trade Confirmations*
○ Stock has fallen 7% from its 52 week high
○ Breakout with good volume
○ About to retest the trendline
○ May even form ascending triangle in some time.
○ Good company by fundamentals.
*Trade Setup*
○ Target - 3300
○ Stop loss - 3040
Thank you for viewing my ideas and analysis
Follow me so that you'll get notified whenever I post some content.
Let me know through the comment section if you have any doubts or feedbacks.
All the best! Happy trading/investing :)

FULL SEND TCS TO ₹4440 : NEW ATH INCOMINGMost of the large caps mimic the same setup.
Long term bullish trend intact.
Measure move on horizontal ranges S/R
Bullish ascending triangle.
LONG TF out of it! NSE:TCS

TCS Outlook - June 2021 PredictionTCS looks poised to breach the upper resistance zone and breakout to reach new All Time High. 3217.2 acts as a strong supply zone and the uptrend also has a good volume support to keep the momentum intact for TCS to scale new highs. Go Long for T1 - 3360, T2 - 3400, T3 - 3450 and T4 - 3500 with trailing stop loss of 10 Rs. Trade wise and safe.

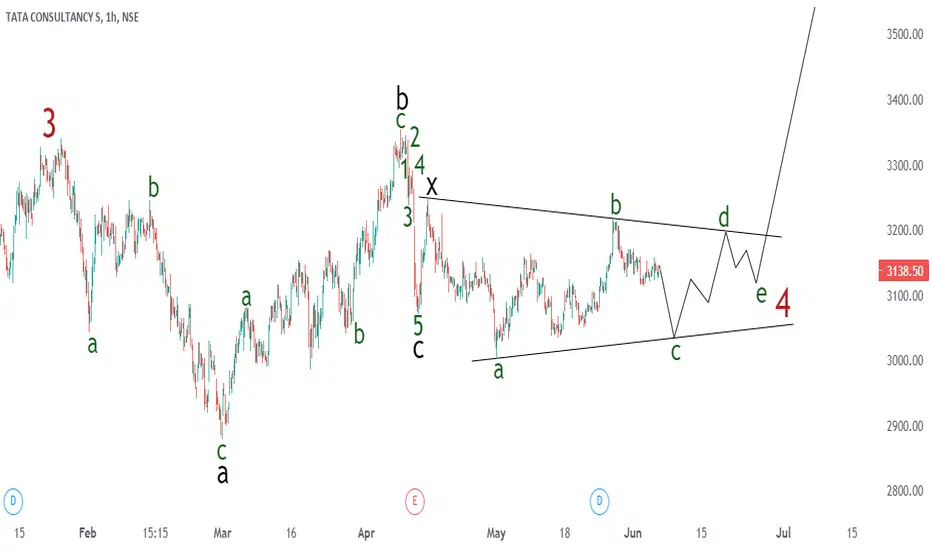
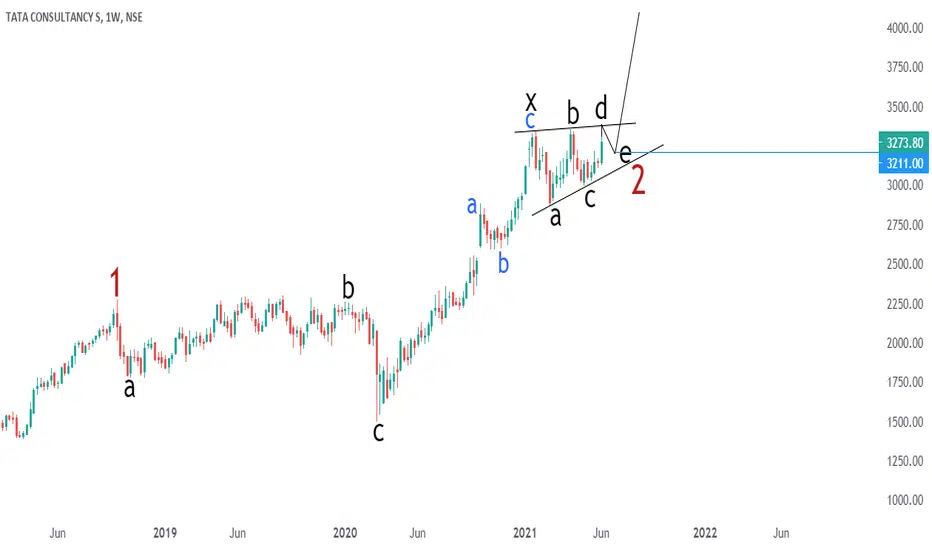
TCS wave analysisstill 3 year wave 2 correction is not completed,wave e of triangle is pending before powerful 3rd wave rally


DOUBLE BREAKOUT IN TCS WITH RISK REWARD RATIO OF 1:3HI GUYS I HOPE YOU ALL LIKE MY ANALYSIS I WAS JUST LOOKING AT THE CHARTS AND I FOUND THIS WONDERFUL SETUP IN TATA CONSULTANCY SERVICES WITH RISK TO REWARD RATIO OF 1:3 . DOUBLE BREAKOUT GIVES MORE CONFIRMATION THAT THE STOCK WILL GO UP

TCS Flag and pole pattern Tcs was making flag and pole pattern in 1hr time frame .
Today given a good move . Power of technical analysis.


Tcs cup and handle formation 🍵 on daily time frame tcs forming cup and handle formation, conform above 3215 for target of 3350
TCS - Bullish trend (Intraday - 19/4)Positive Side :
1. Formation of Cup & Handle pattern. Indication for a bull run.
2. The same cup & handle pattern follows for Nifty IT, which gives an additional support for a bullish run for the entire IT stocks.
3. Can expect a huge return, if the market support the uptrend.
Negative Side :
1. Last two monday trading sessions turned out to be a disaster in the market. So, if it follows, IT stocks too can fall along with it. So recommended to keep 20pts below the trendline breakout.


TCSTCS
DAILY CHART
FORMING TRIANGLE PATTERN
BULLISH RSI @ 59
BULLISH CROSSOVER MACD
BULLISH CROSSOVER STOCHESTIC
BUY CMP @ 3183
SL @ 3122
TARGET @ 3522


BUY at current levelmoving averages are converging and
supertrend positive and macd is signalling buy