TCS - Intraday Trade SetupTCS CMP - 3176.45
Looking bearish in higher time frame. One can go for Intraday / Swing Trade setup with the following entry, exit & targets
Sell Range 3160 - 3155 ONLY / Stop Loss 3180
Target 1 - 3145
Target 2 - 3135
Target 3 - 3125
Disclaimer: This is my view and for educational purpose only.
TCS trade ideas

TCS: Buy & hold for long term: India By Sun Storm Investment Research
A Profit & Solutions Strategy
Disclaimer: I am not a financial advisor, so please do your own research before trading anything

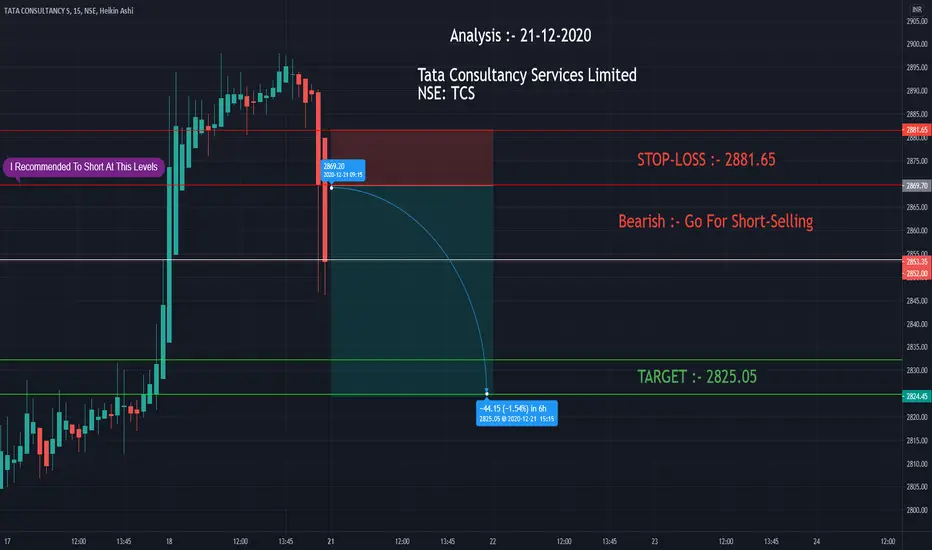
TCS { Short 30 M } As per charts
Note :-
Entry - At the break of mentioned candle's low/high
Stop Loss -
In a Short Trade, I always use Previous Candle High ( PCH ) as a stop loss while entering the trade. Sometime I might use 15 M tf SL & trade in 30M tf which I'll mention. Vice Versa for long trades
Trailing Stop Loss ( TSL ) - Mostly I trail stop loss by PCH as price falls . I exit as PCH breaks & vice versa
Use of PSAR as TSL :- TSL get's hit in trend following due to noise, In such cases I use PSAR to be in trend & exit if PSAR direction change
You can use any one of above mentioned or your own way to manage risk
Time Frame :- I take ~ 90% of my intraday trades in 15m tf. Where my analysis might come from higher frames like W , D or 1hr chart pattern which will be mentioned.
t
Target :- I do set target line based on support / resistance slightly above/ below it . Please pay attention to it


TCS: Buy & Hold: IndiaHappy New Year
By Sun Storm Investment Research
A Profit & Solutions Strategy
Disclaimer: I am not a financial advisor, so please do your own research before trading anything

TCS - some perspectiveIT sector has been outperforming NIFTY in 2020. It seems its time for TCS to lead the IT performance in 2021

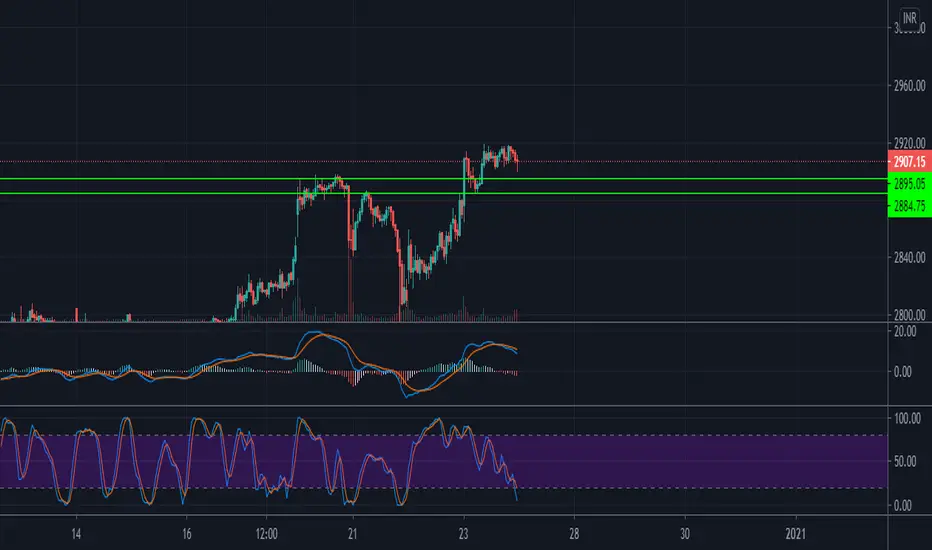
TCS Given a breakout on DAY - RESISTANCETCS given a breakout above 2887 in last to last trading session.
It tried to come down in last trading session but could not.
Hence, if it breaks last high, then BIUY position can be considered. SL - 2887.
P.S.
Follow our Telegram Channel for
1. NIFTY / BankNifty - Support / Resistance intraday Levels.
2. harmonic Reversals Stock ideas / Updates
3. Harmonic Swing Ideas / Updates

TCS Breakout on DAY _ RESISTANCETCS given a breakout above 2887 in last to last trading session.
It tried to come down in last trading session but could not.
Hence, if it breaks last high, then BIUY position can be considered. SL - 2887.
P.S.
Follow our Telegram Channel for
1. NIFTY / BankNifty - Support / Resistance intraday Levels.
2. harmonic Reversals Stock ideas / Updates
3. Harmonic Swing Ideas / Updates

tcs hy all of u guys there is two view for tomorrow.
breakout retest entry and stop loos should be ur money management

rounding bottom formation neck line breakoutstock has broken neckline of rounding bottom but volumes are not coming , enter if breaks high with volume .

Rounding bottom with increased volume, a BO candidateTCS forming rounded bottom and increase in volumes. Preferably a BO candidate with target around 3100


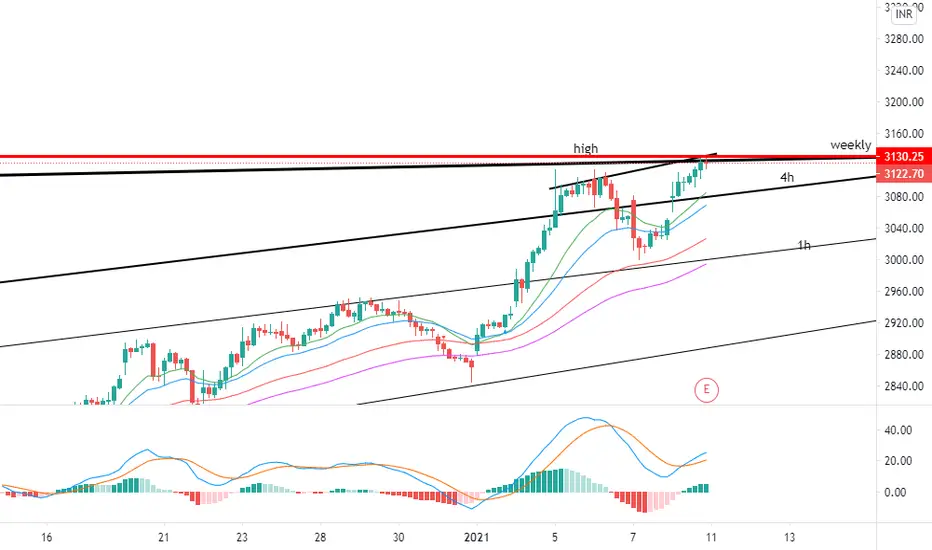
TCS 4HRBearish BAT with Top Reversal is a two bar Sign Of Weakness. First bar is widespread up bar closing on/off the high with high volume supply swamping demand or low volume-no demand. The high and the close are higher than the previous few bars. The second bar is widespread down bar closing on/off the low on higher or lower volume than the first bar
AS second bar close & low are lower than the first bar low, on volume higher than the first bar volume, it shows effort to go down is successful and if second bar high is higher than the first bar high it shows additional weakness. It shows immediate weakness (Effort vs Result) & can be traded immediately on first No Demand or Up-thrust.
POTENTIAL SELL


Buy on Dips until Big fund Manager (FII's) has Long on this.As we all Know that this a very heavy weight stock, which is one of a favorite stock of FII's and also a Nifty's Ride, So the Idea is, while FII's is a buyer try to buy every dip. In an Intraday, try to catch on 40 RSI in 15 min. chart and as same for Positional in 1 Hr. chart. But for Intraday we can Sell Below 2838-2804= for 34 points.

TCS 4HRBEARISH BAT
price need to follow Green Trend line & hit target
If price Breaks Red Trend line is where EXIT before SL hits
POTENTIAL SELL


TCS is bullish should buy from daily trendline supportTCS is bullish should buy from daily trendline support

TCS 2.0Nice chart formation, and a consistent move in the channel. After some consolidation looking good for 3K this time !!
