TCS trade ideas

TCS
NSE:TCS
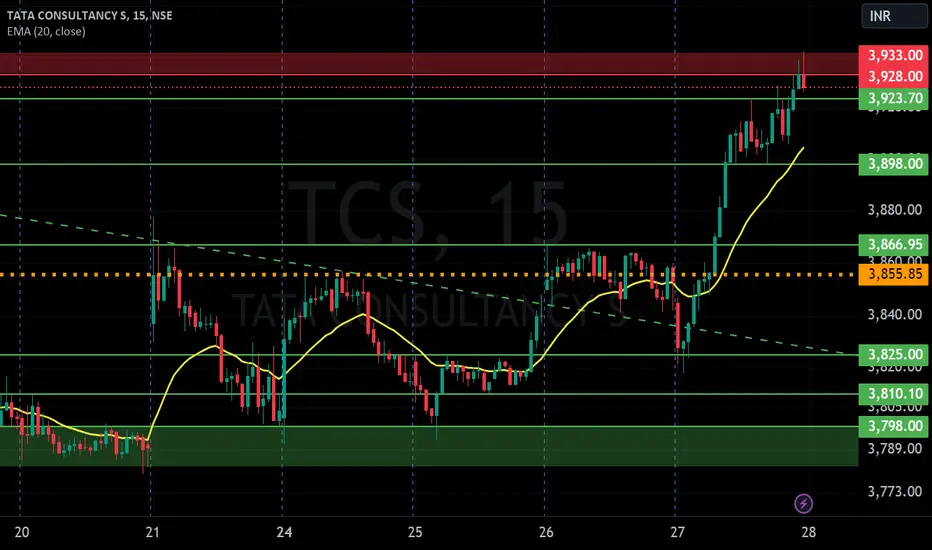
One Can Enter Now !
Or Wait for Retest of the Trendline (BO) !
Or wait For better R:R ratio !
Note :
1.One Can Go long with a Strict SL below the Trendline or Swing Low.
2. R:R ratio should be 1 :2 minimum
3. Plan as per your RISK appetite and Money Management.
Disclaimer : You are responsible for your Profits and loss, Shared for Educational purpose

TCS S/R for 6/8/24Support and Resistance Levels: In technical analysis, support and resistance levels are significant price levels where buying or selling interest tends to be strong. They are identified based on previous price levels where the price has shown a tendency to reverse or find support.
Support levels are represented by the green line and green shade, indicating areas where buying interest may emerge to prevent further price decline.
Resistance levels are represented by the red line and red shade, indicating areas where selling pressure may arise to prevent further price increases. Traders often consider these levels as potential buying or selling opportunities.
Breakouts: Breakouts occur when the price convincingly moves above a resistance level (red shade) or below a support level (green shade). A bullish breakout above resistance suggests the potential for further price increases, while a bearish breakout below support suggests the potential for further price declines. Traders pay attention to these breakout signals as they may indicate the start of a new trend or significant price movement.
20 EMA: The yellow line denotes 20 EMA, to interpret the 20 EMA, you need to compare it with the prevailing stock price. If the stock price is below the 20 EMA, it signals a possible downtrend. But if the stock price is above the 20 EMA, it signals a possible uptrend.
Disclosure: I am not SEBI registered. The information provided here is for learning purposes only and should not be interpreted as financial advice. It is important to consult with a qualified financial advisor before making any investment decisions. Tweets neither advice nor endorsement.

Turning back, the upper boundary continues to riseTurning back, the upper boundary continues to rise
Two oscillation intervals, with the upper one breaking through and rising

Cup & Handle Breakout in TCSAfter Breakout confirmation TCS retesting breakout level ,Providing good entry level .Target will be 4400 level for long term & stoploss would be 3620

TCS S/R for 29/7/24Support and Resistance Levels: In technical analysis, support and resistance levels are significant price levels where buying or selling interest tends to be strong. They are identified based on previous price levels where the price has shown a tendency to reverse or find support.
Support levels are represented by the green line and green shade, indicating areas where buying interest may emerge to prevent further price decline.
Resistance levels are represented by the red line and red shade, indicating areas where selling pressure may arise to prevent further price increases. Traders often consider these levels as potential buying or selling opportunities.
Breakouts: Breakouts occur when the price convincingly moves above a resistance level (red shade) or below a support level (green shade). A bullish breakout above resistance suggests the potential for further price increases, while a bearish breakout below support suggests the potential for further price declines. Traders pay attention to these breakout signals as they may indicate the start of a new trend or significant price movement.
20 EMA: The yellow line denotes 20 EMA, to interpret the 20 EMA, you need to compare it with the prevailing stock price. If the stock price is below the 20 EMA, it signals a possible downtrend. But if the stock price is above the 20 EMA, it signals a possible uptrend.
Disclosure: I am not SEBI registered. The information provided here is for learning purposes only and should not be interpreted as financial advice. It is important to consult with a qualified financial advisor before making any investment decisions. Tweets neither advice nor endorsement.

TCS Start for upside possible " 4444 " TCS Start for upside possible target " 4444 " Now 4024 upside possible target 4200-4300-4444 stoploss 3850

TCS gives brake out from Cup Handle Pattern NSE:TCS
TCS GIVES Brake out ON Daily Chart from Cup Handle Pattern.
I Am buying Tcs Stock on my buy level near 4150
and i Will follow sl of 3600
for geting target of 5200
Risk Reward 1:2
Return On Capital 25%
Time Duration 3-6 months

TCS S/R for 24/7/24Support and Resistance Levels: In technical analysis, support and resistance levels are significant price levels where buying or selling interest tends to be strong. They are identified based on previous price levels where the price has shown a tendency to reverse or find support.
Support levels are represented by the green line and green shade, indicating areas where buying interest may emerge to prevent further price decline.
Resistance levels are represented by the red line and red shade, indicating areas where selling pressure may arise to prevent further price increases. Traders often consider these levels as potential buying or selling opportunities.
Breakouts: Breakouts occur when the price convincingly moves above a resistance level (red shade) or below a support level (green shade). A bullish breakout above resistance suggests the potential for further price increases, while a bearish breakout below support suggests the potential for further price declines. Traders pay attention to these breakout signals as they may indicate the start of a new trend or significant price movement.
20 EMA: The yellow line denotes 20 EMA, to interpret the 20 EMA, you need to compare it with the prevailing stock price. If the stock price is below the 20 EMA, it signals a possible downtrend. But if the stock price is above the 20 EMA, it signals a possible uptrend.
Disclosure: I am not SEBI registered. The information provided here is for learning purposes only and should not be interpreted as financial advice. It is important to consult with a qualified financial advisor before making any investment decisions. Tweets neither advice nor endorsement.

TCS-Nice BreakoutTCS-Nice Breakout
Capital to be deployed -20k
Investing Price -4280-4300
Breakout Price -4265
Stoploss -3872
Targets -4800-5100-5600
#TCS #StockMarketindia #StockToWatch #StocksInFocus #stockstowatch #StocksToTrade

TCS Breaks March High with Volume Support: Potential UptrendTata Consultancy Services (TCS) has surpassed its March high, supported by strong volume, indicating a potential uptrend. Traders should watch for further gains as the stock shows positive momentum.

buy TCS Inverse head and shoulder pattern in TCS. You can buy for the given target with strict stoploss. Market Cap ₹ 15,60,952 Cr.
Tata Consultancy Services is the flagship company and a part of Tata group. It is an IT services, consulting and business solutions organization that has been partnering with many of the world's largest businesses in their transformation journeys for over 50 years. TCS offers a consulting-led, cognitive powered, integrated portfolio of business, technology and engineering services and solutions

buy TCS with targetBuy TCS according to inverse head and shoulder pattern for the given target in graph with strict stoploss. Tata Consultancy Services is the flagship company and a part of Tata group. It is an IT services, consulting and business solutions organization that has been partnering with many of the world's largest businesses in their transformation journeys for over 50 years.

TCS S/R for 15/7/24Support and Resistance Levels: In technical analysis, support and resistance levels are significant price levels where buying or selling interest tends to be strong. They are identified based on previous price levels where the price has shown a tendency to reverse or find support.
Support levels are represented by the green line and green shade, indicating areas where buying interest may emerge to prevent further price decline.
Resistance levels are represented by the red line and red shade, indicating areas where selling pressure may arise to prevent further price increases. Traders often consider these levels as potential buying or selling opportunities.
Breakouts: Breakouts occur when the price convincingly moves above a resistance level (red shade) or below a support level (green shade). A bullish breakout above resistance suggests the potential for further price increases, while a bearish breakout below support suggests the potential for further price declines. Traders pay attention to these breakout signals as they may indicate the start of a new trend or significant price movement.
20 EMA: The yellow line denotes 20 EMA, to interpret the 20 EMA, you need to compare it with the prevailing stock price. If the stock price is below the 20 EMA, it signals a possible downtrend. But if the stock price is above the 20 EMA, it signals a possible uptrend.
Disclosure: I am not SEBI registered. The information provided here is for learning purposes only and should not be interpreted as financial advice. It is important to consult with a qualified financial advisor before making any investment decisions. Tweets neither advice nor endorsement.

TCS- Buy-Swing trade- Will this be the end of downward range? NSE:TCS
01.07.2024
Buy Above:Strictly above 400
Target:4191
Stop Loss: 3812
1. Inside bar Breakout
2. Momentum gain in IT Sector
3. Price crossed above previous lower high in the downward range
by rejecting 200 EMA & channel midway.
4. Also price is above 21 & 50 EMA
5. Key level rejection found & fake breakout found in previous lower low
6. Price crosses 0.618 Fibonacci level in downward trend.
7. Good volumes in upside movement & low volumes in bearish candles

TCS- Analysis Important level is 3733 to 3658 above this bullish below this bearish
Bullish Levels -above 3733 then 3888 to 3962 (CMP is above this) then 4346 to 4421 then 4805 to 4880 then 5264 to 5338 then 5723 to 5797
Bearish levels :- Below 3658 then 3503 to 3429 then 3045 to 2970 last hope then 2586 to 2511
**Disclaimer -
I am not a SEBI registered analyst or advisor. I does not represent or endorse the accuracy or reliability of any information, conversation, or content. Stock trading is inherently risky and the users agree to assume complete and full responsibility for the outcomes of all trading decisions that they make, including but not limited to loss of capital. None of these communications should be construed as an offer to buy or sell securities, nor advice to do so. The users understands and acknowledges that there is a very high risk involved in trading securities. By using this information, the user agrees that use of this information is entirely at their own risk.
Thank you.

TCS Next Target is Channel Bottom. Now in 0.6 FibonacciNow TCS Reached 0.6 Fibonacci Retracement Target, after Breakout the Rising Wedge Pattern. And TCS Next Target is the Channel Bottom.
I want to help people to Make Profit all over the World.

TCS S/R for 2/7/24Support and Resistance Levels: In technical analysis, support and resistance levels are significant price levels where buying or selling interest tends to be strong. They are identified based on previous price levels where the price has shown a tendency to reverse or find support.
Support levels are represented by the green line and green shade, indicating areas where buying interest may emerge to prevent further price decline.
Resistance levels are represented by the red line and red shade, indicating areas where selling pressure may arise to prevent further price increases. Traders often consider these levels as potential buying or selling opportunities.
Breakouts: Breakouts occur when the price convincingly moves above a resistance level (red shade) or below a support level (green shade). A bullish breakout above resistance suggests the potential for further price increases, while a bearish breakout below support suggests the potential for further price declines. Traders pay attention to these breakout signals as they may indicate the start of a new trend or significant price movement.
20 EMA: The yellow line denotes 20 EMA, to interpret the 20 EMA, you need to compare it with the prevailing stock price. If the stock price is below the 20 EMA, it signals a possible downtrend. But if the stock price is above the 20 EMA, it signals a possible uptrend.
Disclosure: I am not SEBI registered. The information provided here is for learning purposes only and should not be interpreted as financial advice. It is important to consult with a qualified financial advisor before making any investment decisions. Tweets neither advice nor endorsement.

TCS S/R for 1/7/24Support and Resistance Levels: In technical analysis, support and resistance levels are significant price levels where buying or selling interest tends to be strong. They are identified based on previous price levels where the price has shown a tendency to reverse or find support.
Support levels are represented by the green line and green shade, indicating areas where buying interest may emerge to prevent further price decline.
Resistance levels are represented by the red line and red shade, indicating areas where selling pressure may arise to prevent further price increases. Traders often consider these levels as potential buying or selling opportunities.
Breakouts: Breakouts occur when the price convincingly moves above a resistance level (red shade) or below a support level (green shade). A bullish breakout above resistance suggests the potential for further price increases, while a bearish breakout below support suggests the potential for further price declines. Traders pay attention to these breakout signals as they may indicate the start of a new trend or significant price movement.
20 EMA: The yellow line denotes 20 EMA, to interpret the 20 EMA, you need to compare it with the prevailing stock price. If the stock price is below the 20 EMA, it signals a possible downtrend. But if the stock price is above the 20 EMA, it signals a possible uptrend.
Disclosure: I am not SEBI registered. The information provided here is for learning purposes only and should not be interpreted as financial advice. It is important to consult with a qualified financial advisor before making any investment decisions. Tweets neither advice nor endorsement.


TCS S/R for 29/6/24Support and Resistance Levels: In technical analysis, support and resistance levels are significant price levels where buying or selling interest tends to be strong. They are identified based on previous price levels where the price has shown a tendency to reverse or find support.
Support levels are represented by the green line and green shade, indicating areas where buying interest may emerge to prevent further price decline.
Resistance levels are represented by the red line and red shade, indicating areas where selling pressure may arise to prevent further price increases. Traders often consider these levels as potential buying or selling opportunities.
Breakouts: Breakouts occur when the price convincingly moves above a resistance level (red shade) or below a support level (green shade). A bullish breakout above resistance suggests the potential for further price increases, while a bearish breakout below support suggests the potential for further price declines. Traders pay attention to these breakout signals as they may indicate the start of a new trend or significant price movement.
Disclosure: I am not SEBI registered. The information provided here is for learning purposes only and should not be interpreted as financial advice. It is important to consult with a qualified financial advisor before making any investment decisions. Tweets neither advice nor endorsement.
Tcs Elliot Wave Analysis target 4200Elliott Wave Count:
The chart seems to show a detailed Elliott Wave count, indicating both impulsive (labeled 1, 2, 3, 4, 5) and corrective (labeled A, B, C) waves.
The current wave count suggests the start of a new impulsive wave, with the expectation of further upward movement.
Target and Stop Loss:
The target price is set at 4200.
The suggested stop loss level is 3800.
Corrections:
A 62% correction of the previous trend is marked, which often signifies a strong retracement level in Elliott Wave theory.
Indicators:
The chart includes volume bars, a relative strength index (RSI) at the bottom, and what seems to be a Moving Average Convergence Divergence (MACD) indicator.
These indicators are typically used to confirm the wave counts and the momentum of the stock.
Moving Averages:
The chart shows moving averages (dotted lines) which can act as support or resistance levels.
This analysis suggests a bullish outlook for TCS shares, projecting a move towards 4200, provided the price remains above the stop loss level of 3800. The chart analysis leverages technical indicators and wave theory to forecast potential price movements.

TCS Inverted H&S Setup formationTCS forming a inverted head and shoulder pattern and better entry would be around zone of 50-61.8 fib levels
