TCS trade ideas

TCS - Pennant BreakoutTCS given pennant breakout, a resistance above which need to be broken for upmove,Targets on chart...
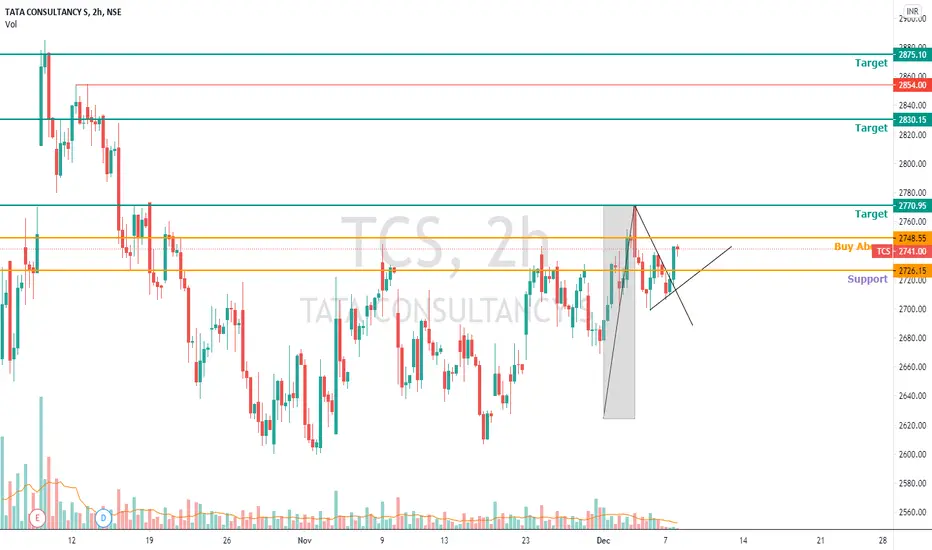

TCS - Intraday / Swing Trade SetupTCS CMP - 2737.70
Looking bullish and range breakout in higher time frame. One can go for Intraday / Swing Trade setup with the following entry, exit & targets
Buy At or Above 2743 / Stop Loss 2730
Target 1 - 2753
Target 2 - 2763
Target 3 - 2775
Disclaimer: This is my view and for educational purpose only.
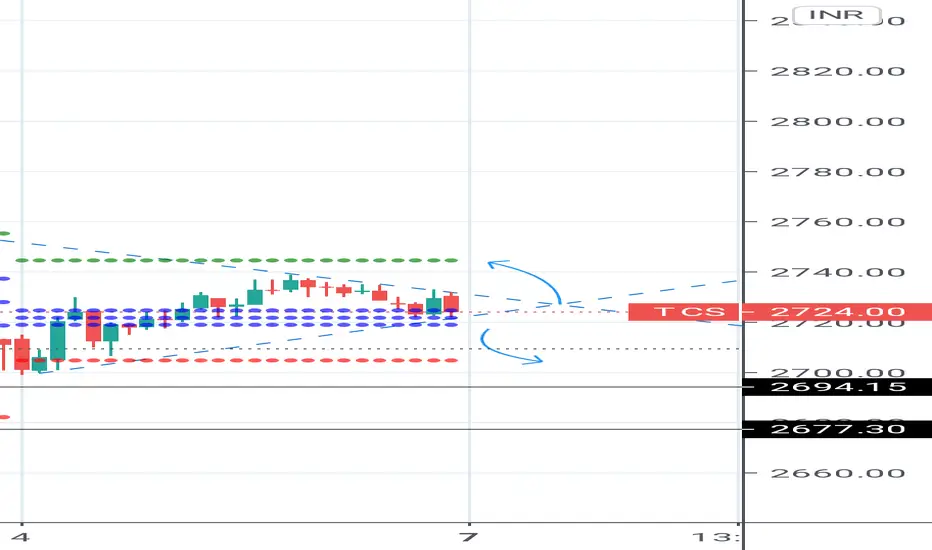
TCS - Reverse Head and ShouldersTCS has been respecting the range proposed in the last idea. Still waiting to see closing above 2744 for a significant upside.
However, we can see formation of a reverse head and shoulders pattern at the resistance line of 2744. This means a breakout on closing basis shall take the stock up fast.

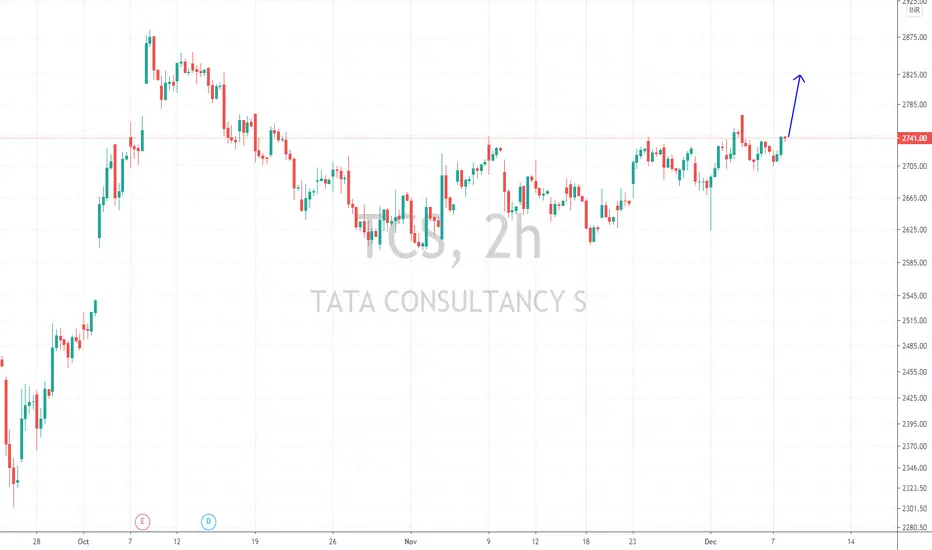
TCS (Breakout Ready ?)TCS has formed a god consolidation pattern and might breakout in this week. Markets support will be required for it to continue.

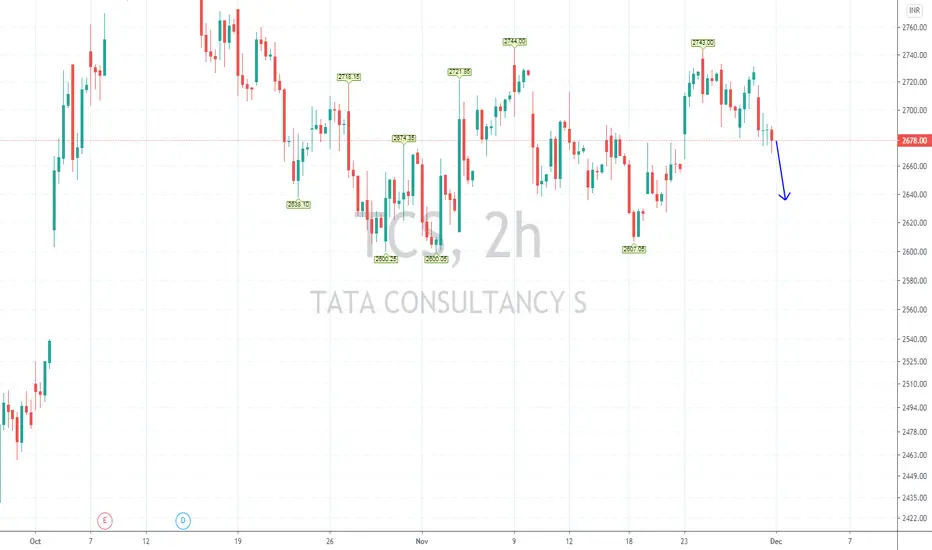
TCS - Intraday / Swing Trade SetupTCS CMP - 2679.65
Looking bearish in higher time frame. One can go for Intraday / Swing Trade setup with the following entry, exit & targets
Sell at or Below 2678 Only / Stop Loss - 2692
Target 1 - 2668
Target 2 - 2658
Target 3 - 2648 / 2635
Disclaimer: This is my view and for educational purpose only.
TCS - December of Sideways MovementAfter a commendable run post good results and buy back. TCS has moved back into its upwards channel and is not consolidating with support of the gap created on Buyback news.
December month is good option to sell calls of 2750 and take long positions on closing above 2750 for 3000 levels.


TCS Long Swing Trade - Bullish Flag in 1 hour chartHi Swing Traders,
Good TCS bullish flag structure. Possible 5-6% Target with a small Stop Loss of 2%. More explanation in the chart
I hope you will benefit from this knowledge.
-MetaVish

TCS - Breakout & Retesting (Bull Flag & Double Bottom) - SwingThis analysis is purely based on price action and chart pattern.
Analysis is done on daily TF hence it may take several days to couple of weeks to reach its target. Traders can also take advantage of this analysis in intraday trades.
Trade Strategy along with logic is explained in image itself.
Always plan your trade & trade your plan
Keep trailing SL accordingly once entered into the trade.
This analysis is purely for education purpose. Kindly do your own study before entering into any trade .
Feel Free to comment for any query and suggestion.


TCS viewAfter a big run TCS paused for some time. And didn't close in weekly candle below 2650. Now it's looks like to ready for another break out in chart and RSI. If close above 2680 in 1 hour candle buy simple.

TCS Falling wedge and accumulation phase TCS made a flag and price is being accumulated, nice falling wedge pattern indicating for breakout.

TATA CONSULTANCY S 1HRBULLISH BAT
price need to follow Green Trend line & hit target
If price Breaks Red Trend line is where EXIT before SL hits
POTENTIAL BUY


TCS 1 D CHART - Consolidating inside a trianglePlease enter the trade once u get a proper breakout or reversal from the levels, Do not hesitate to contact me with any queries. Kindly support my views. Thanks


