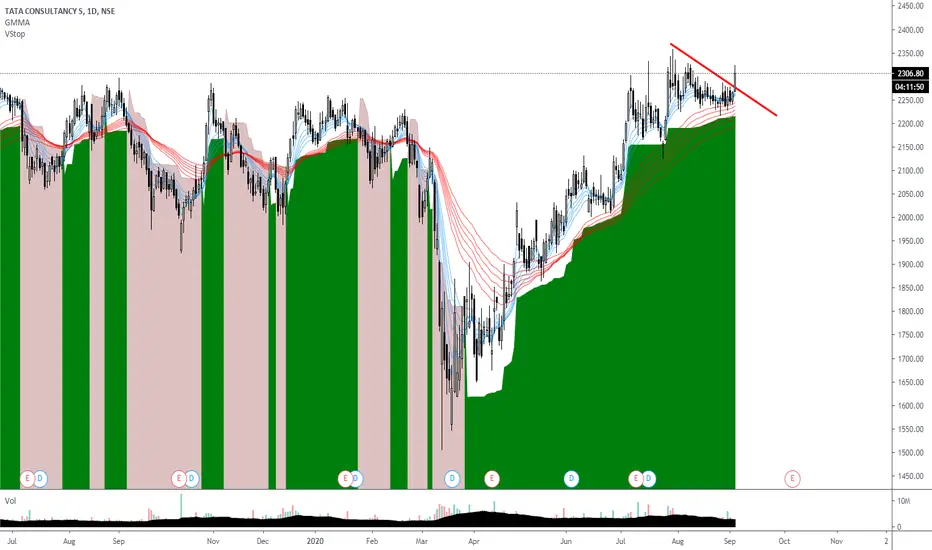
TCS chart analysis on daily and weekly timeframesTCS is a buy:
Beautiful chart! It shows resistance getting weaker after multiple tests! It finally broke!
The stock is above 200 periods moving average
Clear break on the daily chart after consolidation
RSI is very strong, actually overbought.
I suggest wait for a small pullback and enter the trade
Target close to 2900
Safe stop-loss is around 1984
Good luck!
TCS trade ideas

Live Intraday Trading - Trading a positive news in a stock !!A gapped up opening in the morning , similarly a positive news in the stock . Just waited for a perfect entry .
Usually the stock in news are very volatile , so they must be traded very cautiously .

Live Intraday Trading - Sell when everybody is buying !!Most of you might have read that you must sell a stock when everybody is buying . This is just a pure example of that .
A time when everybody want's to buy a stock because of share buy back news . I was selling with full confidence and see the result .
It's not like trading against the trend but it's a matter of time when you gain such experience .
Thank you !!!


Live Intraday Trading - Rejection !!!How to identify rejection at particular levels ??
Look at my trade , where I have identified multiple levels of rejection which gave me a decent profit .
Though nifty is rising higher it doesn't look's like it was going to sustain(Nifty was also trading near it's resistance level) . That was the another reason for shorting .
I covered my partials near the support area or my target area . Though it did not touched my target but it was very close where I covered my partials and got out when it hit my stop loss .
Tip of the day : If you want to be a successful trader , you need to be very watchful .
Thank you !!!
Sturdy_Intraday_Trading

Ascending triangle breakoutTcs forms an ascending triangle pattern in hourly time frame , breakout may occurs at tomorrow . Also it forms bullish engulfing candlestick Pattern in 4hr time frame . Target may seen up to 5560 and 5600 .


TCS does it give similar returns like infy or other it stocks?I am looking at TCS for long time, well for one month, but it did not brake to new highs.
Now it broke the descending triangle pattern.
Does it give the similar brake out like infy or wipro?
Let see
Your humble trader
Kiran
Bullish Shark - TCS - 2 Hour TF.Hello,
Pattern : Bullish Shark
Stock : NSE:TCS
Time Frame : 2 Hour TF.
Always look for reversal patterns in rectangle box area which is a reversal zone and take trade basis on it.
Note : This chart is only for study and reference purpose.


Live Intraday Trading - How to trade a rounding bottom pattern ?The stock was consolidating near the day's high . At the same time it formed a beautiful rounding bottom pattern which was my second perfect green trade of the day.

TCS resistance Break | 3000 + comingTCS just broke the supply really undervalued companied among other tech giant having price in $ not justifying the price here.
this stock value more than 5000 rs we just stated here
below 2350 is a good buy with stop below 2100

Sell TCS for first target of 2280 and second target of 2240Double top formation at highest resistance price level confirming that trend reversal.
RajaMegha


TCS - Big potential stock for upside move TCS-- broken an important resistance and has given along term breakout .. rsi also above level 60 and already tested this level. so i think in coming days it twill move up sharply ..
if u don't want to enter now then let is come back to same level for retest in coming days .. but those are aggressive traders .. can enter for a quick gain ..ensure to enter to see the latest development this stock sand market during weekends .
but one this is sure add it in your watch-list..

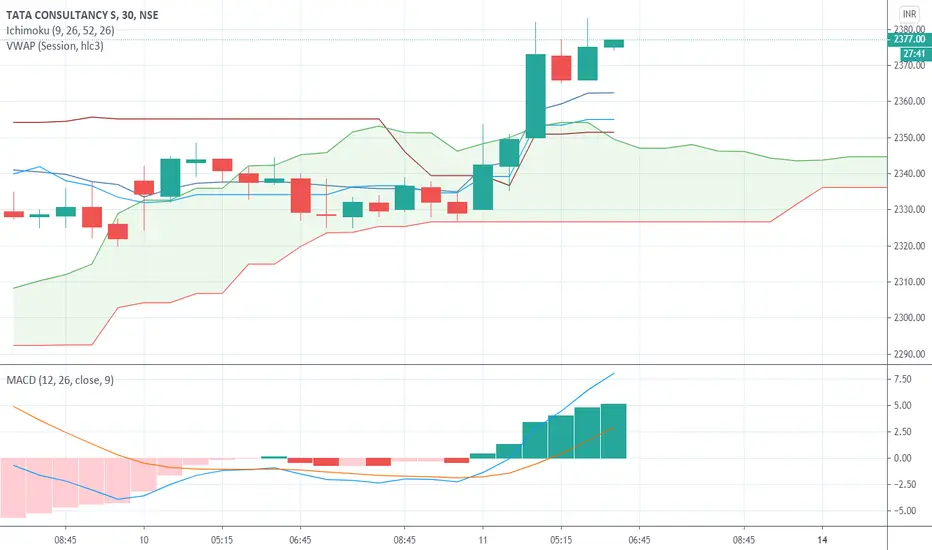
R-0210 TCS about to break R2 2374 next resistance 2490 GO LONGShort Term Cash Buy TCS @2360.00-2367.7 SL 2313.7 TGT 2449(Short term trend remains positive)
Last time we did 2285->2360 and booked good profit, it is continuation of short term trend.
Above VWAP and about to break R2 2378-2383 once it breaks it convincingly can see upside in the range 2450-2490.
MACD cross over + TK cross over + folloed by ichomoku cloud break out
Live Intraday Trading - Trading a BULL FLAG formationA bull flag formation and a good entry for small profit .

Live Intraday Trading - Gap Closing identified for Rs.30KWhat can happen if you start identifying the trend of stock . It's a pure example of Gap closing . Though it opened down there were clear signs of gap closing .
Watch out for the entry point and exit after hitting the target area.

