TCS Short at 1900 ST 1970We are doing Analysis of TCS on 1 Hour Timeframe.
The projected target from the breakout is usually the vertical distance from the high to the bottom .
Note: This is only for Educational Purpose this is not an Investment advice.
Please support the setup with your likes, comments and by following on Trading View.
Thankyou
Ankur Verma
Twitter : Ankurverma3838
TCS trade ideas

Head and shoulder patterThere are buy opportunities as the stock is fundamentally strong we can go long in this way

This is my first chart Head and shouter patternPlease have a look at the pattern if you simplly focus more it will head and shouter pattern has been created there are buy opportunity

TCS - Below 1890 - towards 1850 - 1820TCS if moves Below 1890 it is going towards 1850 - 1820
Stop is at 1905 and 1912
CMP 1902
Stop 1912
Tgt 1855 and 1833
Do not follow blindly, please do your own research.


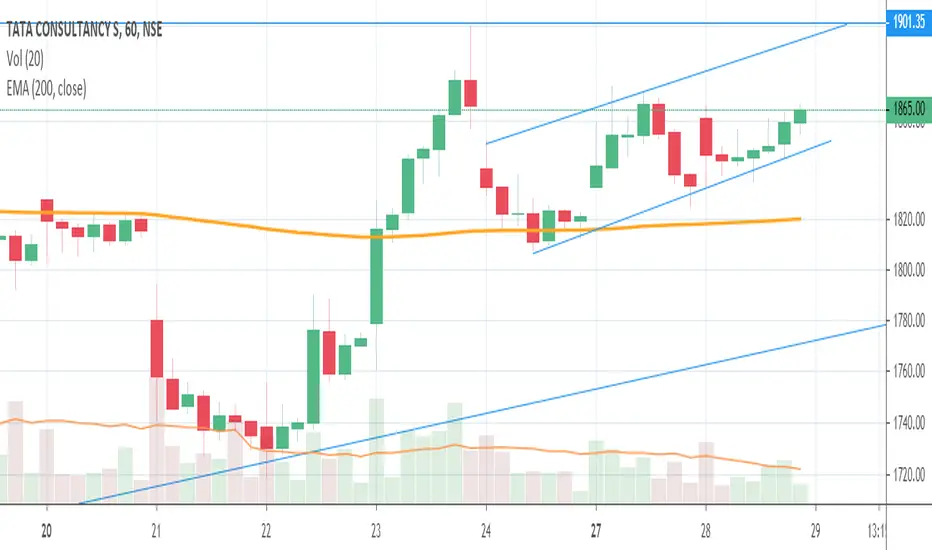
TCS 60 NSE SHORT01) Wolfe Wave ( Bearish )
02) Price near rising channel top
-------------------------------------------------------------
03) Entry - Below Pink Trend line
04) 1st Target - Red Trend line
05) Stop Loss - Above Pink Trend line (White Horizontal line - 1975)
-------------------------------------------------------------
Note : This study for educational purpose only.
-------------------------------------------------------------


TCS buy 1870 Buy TCS above 1870 zone target 1940 ...Holding position on 12 trading days.
Price rejection at 1870 ... if its break it will hit 1900 levels


My analysis On TCS There's two scenarios :
• If the market exceed the blue line then we can talk about a bullish trend;
• Otherwise the line will be hit and go back down for a bearish trend.


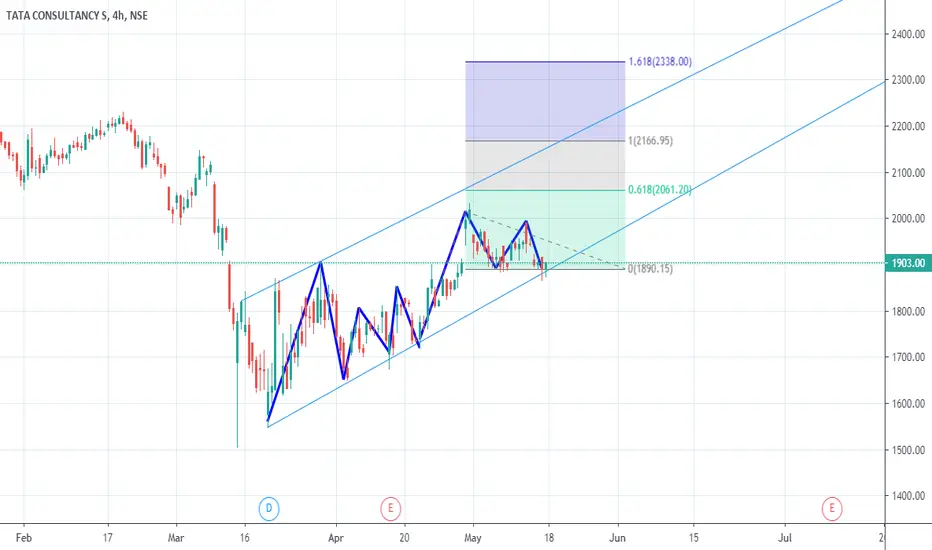
TCS Buy if Cross 1907TCS 1907 double top level if cross then buy with SL 1887 with TGT 1969 ( 61.8% Bounce back from high to low )

TCS INVERTED TRIANGLE PATTERN As per TCS chart seems inverted triangle pattern formed lets see breakout happen in which direction.

TCS BREAKOUT EXPECTEDAs per chart inverted triangle pattern show breakout expecting lets see how market behavior in which direction breakout happen.

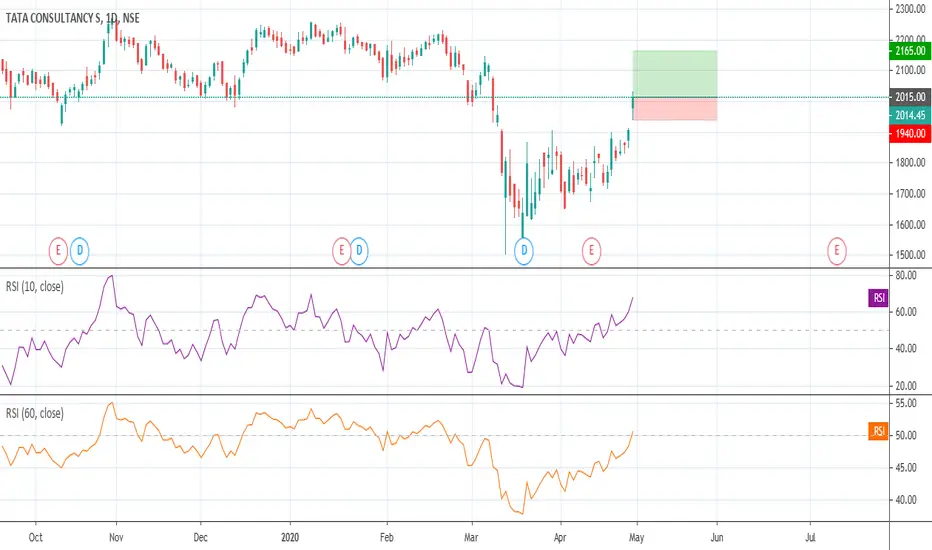
TCS "TRIPLE TOP" will it break it!!?NSE:TCS TCS is currently trading in a range of 1500-1900 but the POSITIVE thing is that it is having HIGHER LOWS which increases the probability of breakout above1900 and it has also formed TRIPLE TOP at 1900 which makes a stronger resistance to break. IF it doesn't break 1900 it may take support again at 1800 and next support is at 1700. According to me the probability of TCS breaking 1900 is higher.

TCS : Wave analysis and price action First an all good morning friends,
Those who are doing trading And likely to trade TCS then they can Short it, For toward target 1745 - 1600
Genuine if you like my ideas then please like it, I need your support.
Thanks


