TCS Alert: Ominous Signs of a Potential ShortTCS exhibits signs of an impending sell-off, marked by key observations:
Close proximity to its all-time high.
Formation of an ending diagonal pattern in the vicinity of the historical peak.
Potential emergence of a flat irregular ABC pattern on the monthly chart spanning from September 2022 to February 2024.
Strategic considerations:
Option 1: Consider initiating a short position promptly.
Option 2: Alternatively, wait for confirmation with the break of Wave 3.
For optimal execution, targeting a short entry near 4010-4000 is advisable. This enables a strategic placement of the stop-loss above the all-time high. As TCS experiences a decline, a systematic trailing of the stop-loss can be implemented to manage potential risks effectively.
TCS trade ideas


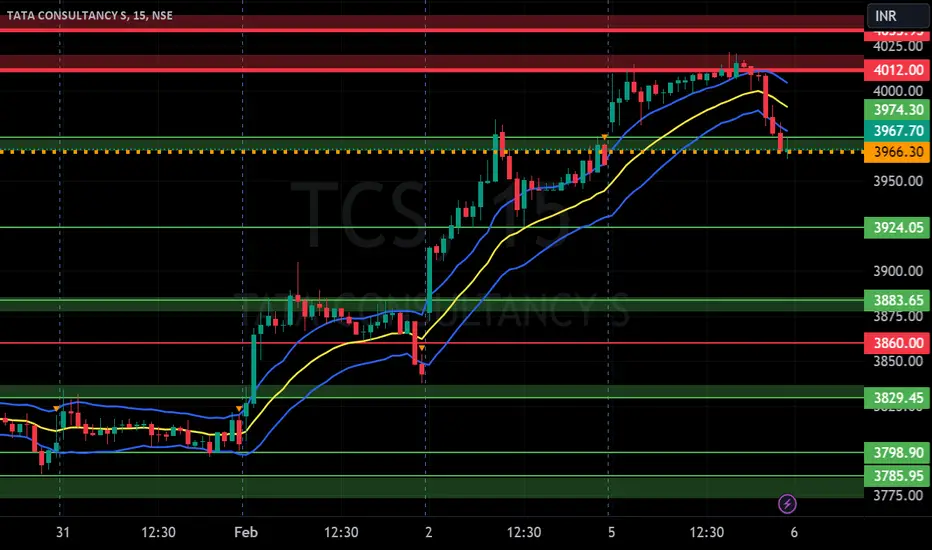
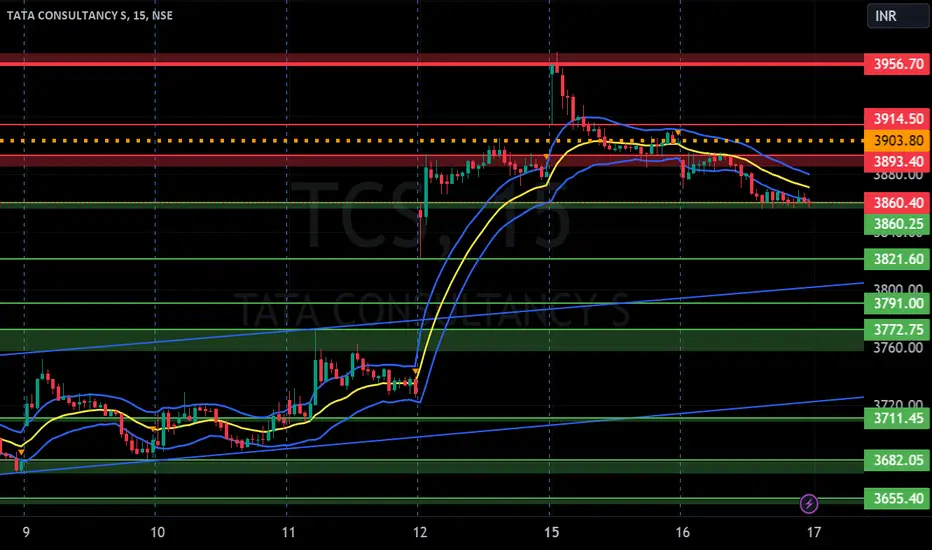
TCS S/R for 6/1/24Support and Resistance Levels:
Based on the price action, you have to identify two significant levels: the red line acting as resistance and the green line acting as support. Additionally, there have marked red and green shades to represent resistance and support zones, respectively.
Support: The green line and green shade represent support levels. These levels are where the price tends to find buying interest, preventing it from falling further. Traders can consider these levels as potential buying opportunities.
Resistance: The red line and red shade represent resistance levels. These levels are where the price tends to encounter selling pressure, preventing it from rising further. Traders can consider these levels as potential selling opportunities.
Breakouts: If the price breaks above the resistance zone (red shade) convincingly, it may indicate a bullish breakout, and the price could move higher to the next resistance level. On the other hand, if the price breaks below the support zone (green shade) convincingly, it may indicate a bearish breakout, and the price could move lower to the next support level.
Keltner Channel:
The Keltner Channel is a technical indicator that uses an exponential moving average (EMA) to create an upper and lower channel around the price action. Traders can use this channel to identify potential long and short positions.
Long Position: If the price is above the upper line of the Keltner Channel, it may indicate a potential long opportunity, as it suggests the price is trading above the average range and might continue in an upward trend.
Short Position: If the price is below the lower line of the Keltner Channel, it may indicate a potential short opportunity, as it suggests the price is trading below the average range and might continue in a downward trend.
Disclosure: I am not SEBI registered. I just wanted to let you know that the information provided here is for learning purposes only. Please consult your financial advisor before making any decisions. Tweets neither advice nor endorsement.
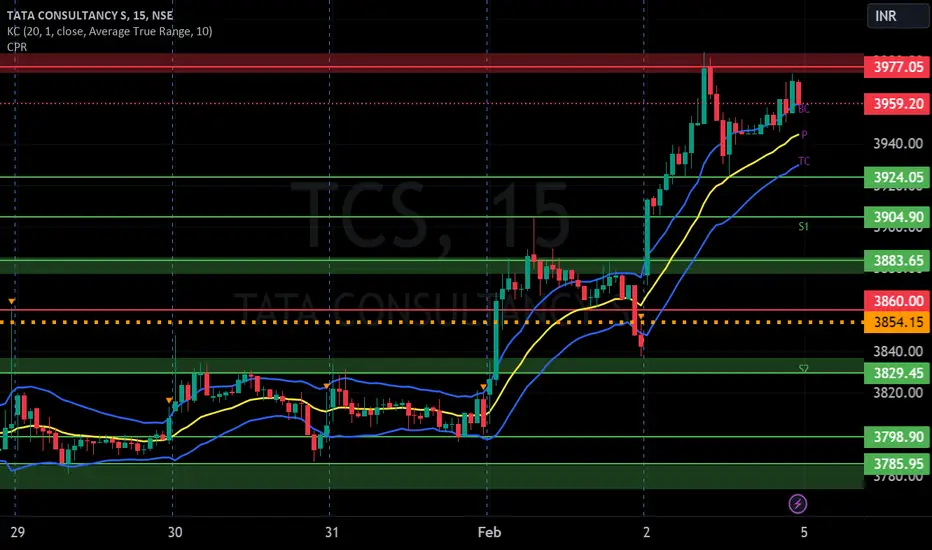
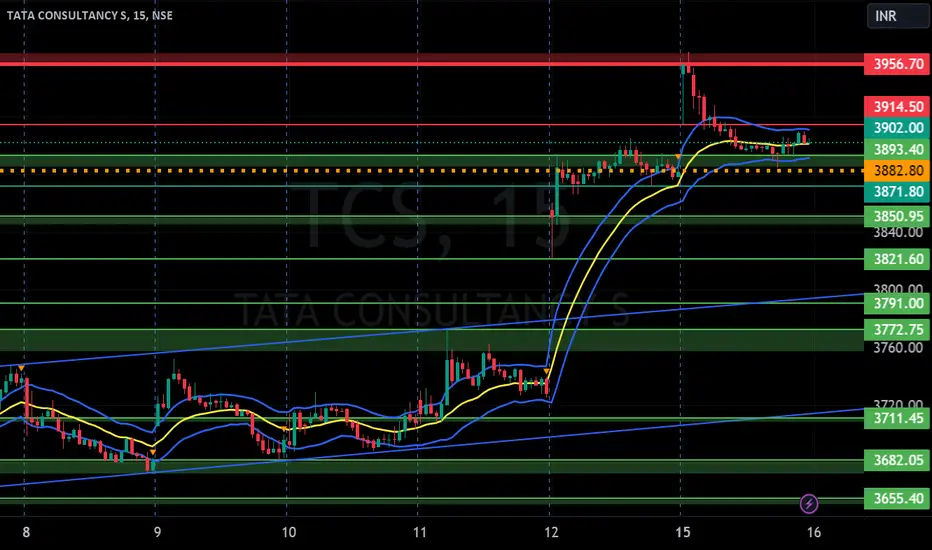
TCS S/R for 5/1/24Support and Resistance Levels:
Based on the price action, you have to identify two significant levels: the red line acting as resistance and the green line acting as support. Additionally, there have marked red and green shades to represent resistance and support zones, respectively.
Support: The green line and green shade represent support levels. These levels are where the price tends to find buying interest, preventing it from falling further. Traders can consider these levels as potential buying opportunities.
Resistance: The red line and red shade represent resistance levels. These levels are where the price tends to encounter selling pressure, preventing it from rising further. Traders can consider these levels as potential selling opportunities.
Breakouts: If the price breaks above the resistance zone (red shade) convincingly, it may indicate a bullish breakout, and the price could move higher to the next resistance level. On the other hand, if the price breaks below the support zone (green shade) convincingly, it may indicate a bearish breakout, and the price could move lower to the next support level.
Keltner Channel:
The Keltner Channel is a technical indicator that uses an exponential moving average (EMA) to create an upper and lower channel around the price action. Traders can use this channel to identify potential long and short positions.
Long Position: If the price is above the upper line of the Keltner Channel, it may indicate a potential long opportunity, as it suggests the price is trading above the average range and might continue in an upward trend.
Short Position: If the price is below the lower line of the Keltner Channel, it may indicate a potential short opportunity, as it suggests the price is trading below the average range and might continue in a downward trend.
Disclosure: I am not SEBI registered. I just wanted to let you know that the information provided here is for learning purposes only. Please consult your financial advisor before making any decisions. Tweets neither advice nor endorsement.
TCS S/R for 2/2/24Support and Resistance Levels:
Based on the price action, you have to identify two significant levels: the red line acting as resistance and the green line acting as support. Additionally, there have marked red and green shades to represent resistance and support zones, respectively.
Support: The green line and green shade represent support levels. These levels are where the price tends to find buying interest, preventing it from falling further. Traders can consider these levels as potential buying opportunities.
Resistance: The red line and red shade represent resistance levels. These levels are where the price tends to encounter selling pressure, preventing it from rising further. Traders can consider these levels as potential selling opportunities.
Breakouts: If the price breaks above the resistance zone (red shade) convincingly, it may indicate a bullish breakout, and the price could move higher to the next resistance level. On the other hand, if the price breaks below the support zone (green shade) convincingly, it may indicate a bearish breakout, and the price could move lower to the next support level.
Keltner Channel:
The Keltner Channel is a technical indicator that uses an exponential moving average (EMA) to create an upper and lower channel around the price action. Traders can use this channel to identify potential long and short positions.
Long Position: If the price is above the upper line of the Keltner Channel, it may indicate a potential long opportunity, as it suggests the price is trading above the average range and might continue in an upward trend.
Short Position: If the price is below the lower line of the Keltner Channel, it may indicate a potential short opportunity, as it suggests the price is trading below the average range and might continue in a downward trend.
TCS--@Breakout or Breakdown ??I am sharing the important levels of Support and Resistance. These levels plays a crucial role in trading decisions, as they act as reliable markers of price movements.
------>>Support levels are price points where an asset tends to find buying interest, preventing it from falling further.
---->Resistance levels, on the other hand, are points where selling pressure typically prevents the asset from rising higher.
Take a look at these levels and trade accordingly. Recognizing and respecting these support and resistance levels can help traders make informed decisions and manage risk effectively. They serve as key reference points for technical analysis and are vital tools in successful trading strategies.
Trade safe...Thank you guys for your support

TCS swing trading Triple bottom breakout on 1h chart. Support candle followed by confirmation candle on day chart.

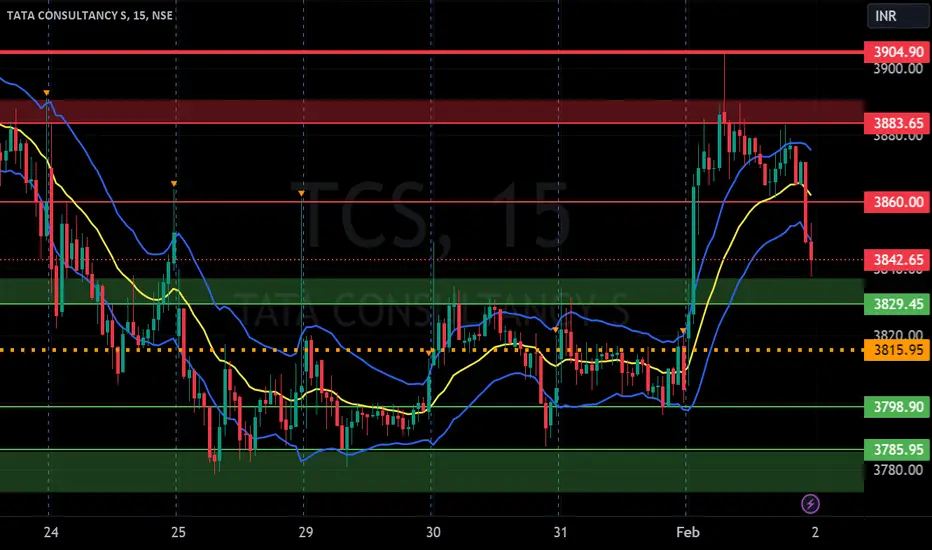
TCS S/R for 1/2/24Support and Resistance Levels:
Based on the price action, you have to identify two significant levels: the red line acting as resistance and the green line acting as support. Additionally, there have marked red and green shades to represent resistance and support zones, respectively.
Support: The green line and green shade represent support levels. These levels are where the price tends to find buying interest, preventing it from falling further. Traders can consider these levels as potential buying opportunities.
Resistance: The red line and red shade represent resistance levels. These levels are where the price tends to encounter selling pressure, preventing it from rising further. Traders can consider these levels as potential selling opportunities.
Breakouts: If the price breaks above the resistance zone (red shade) convincingly, it may indicate a bullish breakout, and the price could move higher to the next resistance level. On the other hand, if the price breaks below the support zone (green shade) convincingly, it may indicate a bearish breakout, and the price could move lower to the next support level.
Keltner Channel:
The Keltner Channel is a technical indicator that uses an exponential moving average (EMA) to create an upper and lower channel around the price action. Traders can use this channel to identify potential long and short positions.
Long Position: If the price is above the upper line of the Keltner Channel, it may indicate a potential long opportunity, as it suggests the price is trading above the average range and might continue in an upward trend.
Short Position: If the price is below the lower line of the Keltner Channel, it may indicate a potential short opportunity, as it suggests the price is trading below the average range and might continue in a downward trend.
TCS S/R for 31/1/24Support and Resistance Levels:
Based on the price action, you have to identify two significant levels: the red line acting as resistance and the green line acting as support. Additionally, there have marked red and green shades to represent resistance and support zones, respectively.
Support: The green line and green shade represent support levels. These levels are where the price tends to find buying interest, preventing it from falling further. Traders can consider these levels as potential buying opportunities.
Resistance: The red line and red shade represent resistance levels. These levels are where the price tends to encounter selling pressure, preventing it from rising further. Traders can consider these levels as potential selling opportunities.
Breakouts: If the price breaks above the resistance zone (red shade) convincingly, it may indicate a bullish breakout, and the price could move higher to the next resistance level. On the other hand, if the price breaks below the support zone (green shade) convincingly, it may indicate a bearish breakout, and the price could move lower to the next support level.
Keltner Channel:
The Keltner Channel is a technical indicator that uses an exponential moving average (EMA) to create an upper and lower channel around the price action. Traders can use this channel to identify potential long and short positions.
Long Position: If the price is above the upper line of the Keltner Channel, it may indicate a potential long opportunity, as it suggests the price is trading above the average range and might continue in an upward trend.
Short Position: If the price is below the lower line of the Keltner Channel, it may indicate a potential short opportunity, as it suggests the price is trading below the average range and might continue in a downward trend.

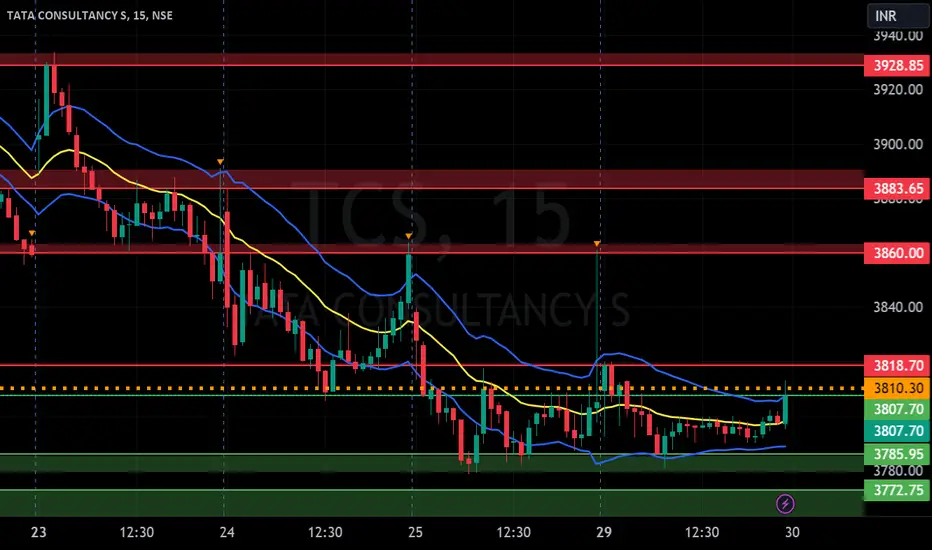
TCS S/R for 30/1/24Support and Resistance Levels:
Based on the price action, you have to identify two significant levels: the red line acting as resistance and the green line acting as support. Additionally, there have marked red and green shades to represent resistance and support zones, respectively.
Support: The green line and green shade represent support levels. These levels are where the price tends to find buying interest, preventing it from falling further. Traders can consider these levels as potential buying opportunities.
Resistance: The red line and red shade represent resistance levels. These levels are where the price tends to encounter selling pressure, preventing it from rising further. Traders can consider these levels as potential selling opportunities.
Breakouts: If the price breaks above the resistance zone (red shade) convincingly, it may indicate a bullish breakout, and the price could move higher to the next resistance level. On the other hand, if the price breaks below the support zone (green shade) convincingly, it may indicate a bearish breakout, and the price could move lower to the next support level.
Keltner Channel:
The Keltner Channel is a technical indicator that uses an exponential moving average (EMA) to create an upper and lower channel around the price action. Traders can use this channel to identify potential long and short positions.
Long Position: If the price is above the upper line of the Keltner Channel, it may indicate a potential long opportunity, as it suggests the price is trading above the average range and might continue in an upward trend.
Short Position: If the price is below the lower line of the Keltner Channel, it may indicate a potential short opportunity, as it suggests the price is trading below the average range and might continue in a downward trend.
TCS S/R for 29/1/24Support and Resistance Levels:
Based on the price action, you have to identify two significant levels: the red line acting as resistance and the green line acting as support. Additionally, there have marked red and green shades to represent resistance and support zones, respectively.
Support: The green line and green shade represent support levels. These levels are where the price tends to find buying interest, preventing it from falling further. Traders can consider these levels as potential buying opportunities.
Resistance: The red line and red shade represent resistance levels. These levels are where the price tends to encounter selling pressure, preventing it from rising further. Traders can consider these levels as potential selling opportunities.
Breakouts: If the price breaks above the resistance zone (red shade) convincingly, it may indicate a bullish breakout, and the price could move higher to the next resistance level. On the other hand, if the price breaks below the support zone (green shade) convincingly, it may indicate a bearish breakout, and the price could move lower to the next support level.
Keltner Channel:
The Keltner Channel is a technical indicator that uses an exponential moving average (EMA) to create an upper and lower channel around the price action. Traders can use this channel to identify potential long and short positions.
Long Position: If the price is above the upper line of the Keltner Channel, it may indicate a potential long opportunity, as it suggests the price is trading above the average range and might continue in an upward trend.
Short Position: If the price is below the lower line of the Keltner Channel, it may indicate a potential short opportunity, as it suggests the price is trading below the average range and might continue in a downward trend.

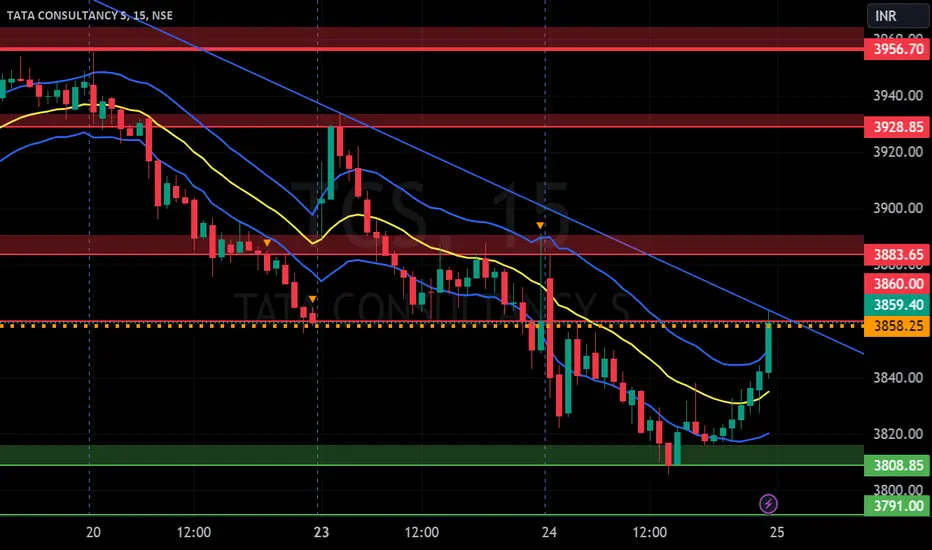
TCS S/R for 24/1/24Support and Resistance Levels:
Based on the price action, you have to identify two significant levels: the red line acting as resistance and the green line acting as support. Additionally, there have marked red and green shades to represent resistance and support zones, respectively.
Support: The green line and green shade represent support levels. These levels are where the price tends to find buying interest, preventing it from falling further. Traders can consider these levels as potential buying opportunities.
Resistance: The red line and red shade represent resistance levels. These levels are where the price tends to encounter selling pressure, preventing it from rising further. Traders can consider these levels as potential selling opportunities.
Breakouts: If the price breaks above the resistance zone (red shade) convincingly, it may indicate a bullish breakout, and the price could move higher to the next resistance level. On the other hand, if the price breaks below the support zone (green shade) convincingly, it may indicate a bearish breakout, and the price could move lower to the next support level.
Keltner Channel:
The Keltner Channel is a technical indicator that uses an exponential moving average (EMA) to create an upper and lower channel around the price action. Traders can use this channel to identify potential long and short positions.
Long Position: If the price is above the upper line of the Keltner Channel, it may indicate a potential long opportunity, as it suggests the price is trading above the average range and might continue in an upward trend.
Short Position: If the price is below the lower line of the Keltner Channel, it may indicate a potential short opportunity, as it suggests the price is trading below the average range and might continue in a downward trend.

TCS S/R for 23/1/24Support and Resistance Levels:
Based on the price action, you have to identify two significant levels: the red line acting as resistance and the green line acting as support. Additionally, there have marked red and green shades to represent resistance and support zones, respectively.
Support: The green line and green shade represent support levels. These levels are where the price tends to find buying interest, preventing it from falling further. Traders can consider these levels as potential buying opportunities.
Resistance: The red line and red shade represent resistance levels. These levels are where the price tends to encounter selling pressure, preventing it from rising further. Traders can consider these levels as potential selling opportunities.
Breakouts: If the price breaks above the resistance zone (red shade) convincingly, it may indicate a bullish breakout, and the price could move higher to the next resistance level. On the other hand, if the price breaks below the support zone (green shade) convincingly, it may indicate a bearish breakout, and the price could move lower to the next support level.
Keltner Channel:
The Keltner Channel is a technical indicator that uses an exponential moving average (EMA) to create an upper and lower channel around the price action. Traders can use this channel to identify potential long and short positions.
Long Position: If the price is above the upper line of the Keltner Channel, it may indicate a potential long opportunity, as it suggests the price is trading above the average range and might continue in an upward trend.
Short Position: If the price is below the lower line of the Keltner Channel, it may indicate a potential short opportunity, as it suggests the price is trading below the average range and might continue in a downward trend.

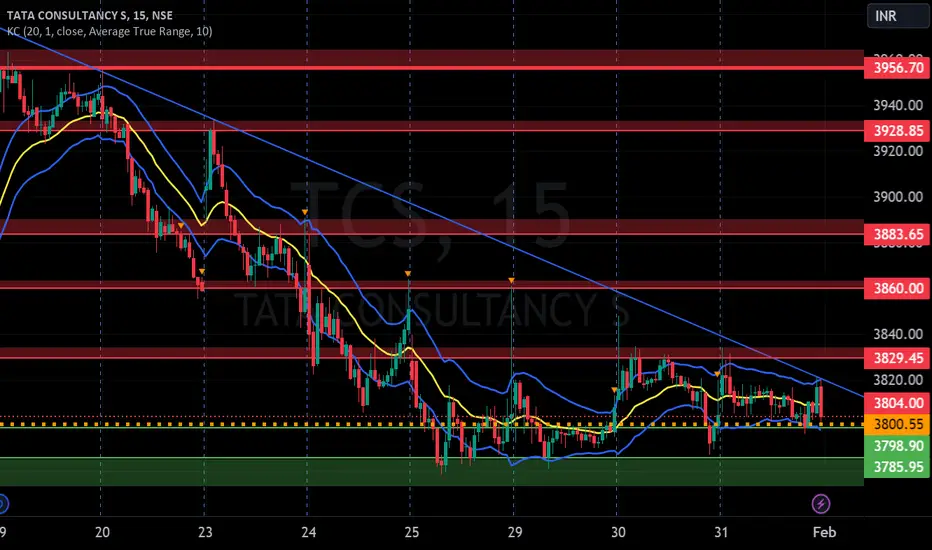
TCS S/R for 20/1/24Support and Resistance Levels:
Based on the price action, you have to identify two significant levels: the red line acting as resistance and the green line acting as support. Additionally, there have marked red and green shades to represent resistance and support zones, respectively.
Support: The green line and green shade represent support levels. These levels are where the price tends to find buying interest, preventing it from falling further. Traders can consider these levels as potential buying opportunities.
Resistance: The red line and red shade represent resistance levels. These levels are where the price tends to encounter selling pressure, preventing it from rising further. Traders can consider these levels as potential selling opportunities.
Breakouts: If the price breaks above the resistance zone (red shade) convincingly, it may indicate a bullish breakout, and the price could move higher to the next resistance level. On the other hand, if the price breaks below the support zone (green shade) convincingly, it may indicate a bearish breakout, and the price could move lower to the next support level.
Keltner Channel:
The Keltner Channel is a technical indicator that uses an exponential moving average (EMA) to create an upper and lower channel around the price action. Traders can use this channel to identify potential long and short positions.
Long Position: If the price is above the upper line of the Keltner Channel, it may indicate a potential long opportunity, as it suggests the price is trading above the average range and might continue in an upward trend.
Short Position: If the price is below the lower line of the Keltner Channel, it may indicate a potential short opportunity, as it suggests the price is trading below the average range and might continue in a downward trend.
TCS S/R for 19/1/24Support and Resistance Levels:
Based on the price action, you have to identify two significant levels: the red line acting as resistance and the green line acting as support. Additionally, there have marked red and green shades to represent resistance and support zones, respectively.
Support: The green line and green shade represent support levels. These levels are where the price tends to find buying interest, preventing it from falling further. Traders can consider these levels as potential buying opportunities.
Resistance: The red line and red shade represent resistance levels. These levels are where the price tends to encounter selling pressure, preventing it from rising further. Traders can consider these levels as potential selling opportunities.
Breakouts: If the price breaks above the resistance zone (red shade) convincingly, it may indicate a bullish breakout, and the price could move higher to the next resistance level. On the other hand, if the price breaks below the support zone (green shade) convincingly, it may indicate a bearish breakout, and the price could move lower to the next support level.
Keltner Channel:
The Keltner Channel is a technical indicator that uses an exponential moving average (EMA) to create an upper and lower channel around the price action. Traders can use this channel to identify potential long and short positions.
Long Position: If the price is above the upper line of the Keltner Channel, it may indicate a potential long opportunity, as it suggests the price is trading above the average range and might continue in an upward trend.
Short Position: If the price is below the lower line of the Keltner Channel, it may indicate a potential short opportunity, as it suggests the price is trading below the average range and might continue in a downward trend.

Tata Consult. should target 4733 after crossing resistanceDaily chart, the stock is trading in an uptrend.
The technical indicators RSI and MACD are showing higher probability to cross the Resistance line (blue) at around 4020 - 4025
After crossing, the target will be 4733
Stop loss below 3830 should be considered

cup and handle pattern in tcs cup and handle pattern formed in up trend .it large cap has not performed yet in this market rally and two days fall in nifty it is still bullish it shows strength in price so we can relay on cup and handle pattern with proper risk management

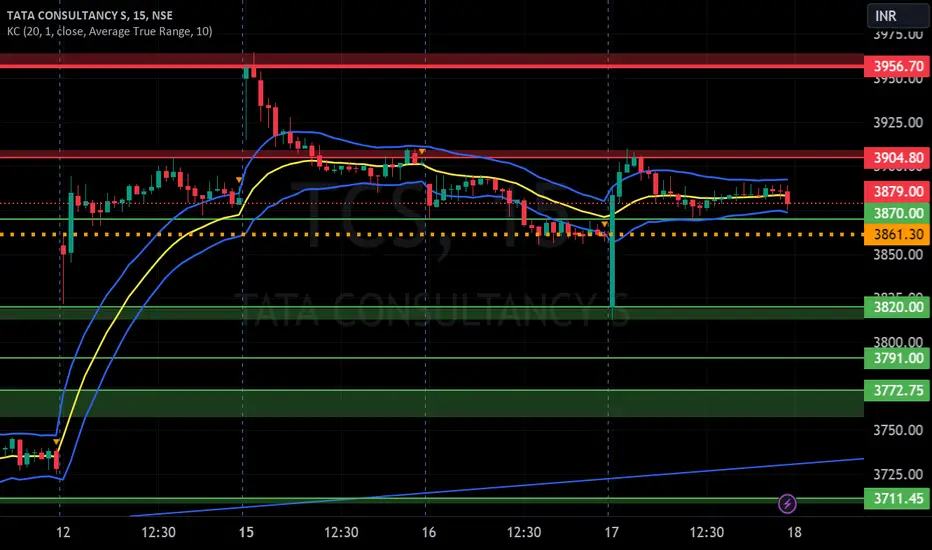
TCS S/R for 18/1/24Support and Resistance Levels:
Based on the price action, you have to identify two significant levels: the red line acting as resistance and the green line acting as support. Additionally, there have marked red and green shades to represent resistance and support zones, respectively.
Support: The green line and green shade represent support levels. These levels are where the price tends to find buying interest, preventing it from falling further. Traders can consider these levels as potential buying opportunities.
Resistance: The red line and red shade represent resistance levels. These levels are where the price tends to encounter selling pressure, preventing it from rising further. Traders can consider these levels as potential selling opportunities.
Breakouts: If the price breaks above the resistance zone (red shade) convincingly, it may indicate a bullish breakout, and the price could move higher to the next resistance level. On the other hand, if the price breaks below the support zone (green shade) convincingly, it may indicate a bearish breakout, and the price could move lower to the next support level.
Keltner Channel:
The Keltner Channel is a technical indicator that uses an exponential moving average (EMA) to create an upper and lower channel around the price action. Traders can use this channel to identify potential long and short positions.
Long Position: If the price is above the upper line of the Keltner Channel, it may indicate a potential long opportunity, as it suggests the price is trading above the average range and might continue in an upward trend.
Short Position: If the price is below the lower line of the Keltner Channel, it may indicate a potential short opportunity, as it suggests the price is trading below the average range and might continue in a downward trend.
Disclosure: I am not SEBI registered. I just wanted to let you know that the information provided here is for learning purposes only. Please consult your financial advisor before making any decisions. Tweets neither advice nor endorsement.
TCS // Short Term Trade Opportunitywww.tradingview.com
NSE: TCS : After touching its 52w HIGH recently, the chart looks Neutral in current pullback condition. The concerning item are Open Gaps. As per Gap theory, every Gap has to be filled. So, why to look for an opportunity, if possible. Here you go:
If TCS goes below 3850 level, one can go SORT having the Bearish view. The first target can be 3820. The next target will be 3750.
For bullish view, if it goes above 3870, you can go for LONG position with the targets as 3897 / 3910 / 3923 / 3965.

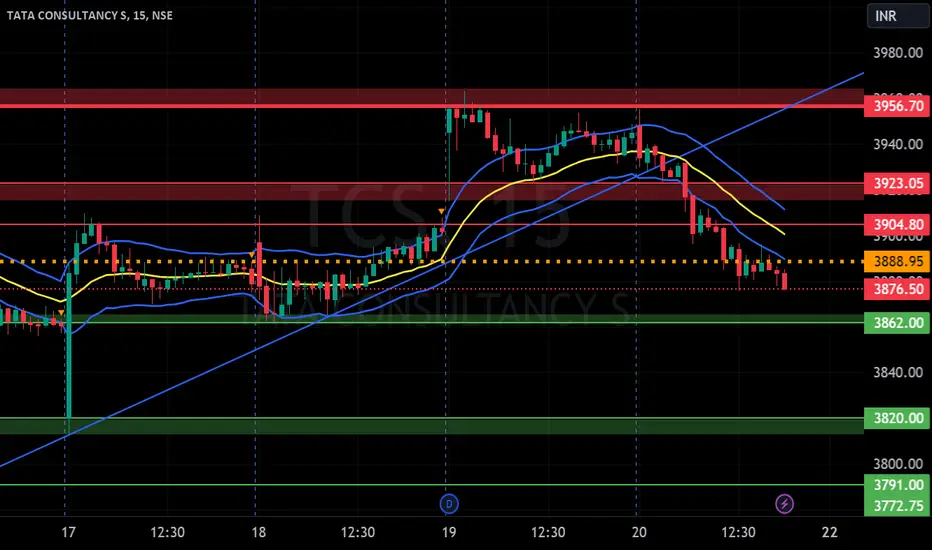
TCS S/R for 17/1/24Support and Resistance Levels:
Based on the price action, you have to identify two significant levels: the red line acting as resistance and the green line acting as support. Additionally, there have marked red and green shades to represent resistance and support zones, respectively.
Support: The green line and green shade represent support levels. These levels are where the price tends to find buying interest, preventing it from falling further. Traders can consider these levels as potential buying opportunities.
Resistance: The red line and red shade represent resistance levels. These levels are where the price tends to encounter selling pressure, preventing it from rising further. Traders can consider these levels as potential selling opportunities.
Breakouts: If the price breaks above the resistance zone (red shade) convincingly, it may indicate a bullish breakout, and the price could move higher to the next resistance level. On the other hand, if the price breaks below the support zone (green shade) convincingly, it may indicate a bearish breakout, and the price could move lower to the next support level.
Keltner Channel:
The Keltner Channel is a technical indicator that uses an exponential moving average (EMA) to create an upper and lower channel around the price action. Traders can use this channel to identify potential long and short positions.
Long Position: If the price is above the upper line of the Keltner Channel, it may indicate a potential long opportunity, as it suggests the price is trading above the average range and might continue in an upward trend.
Short Position: If the price is below the lower line of the Keltner Channel, it may indicate a potential short opportunity, as it suggests the price is trading below the average range and might continue in a downward trend.
Disclosure: I am not SEBI registered. I just wanted to let you know that the information provided here is for learning purposes only. Please consult your financial advisor before making any decisions. Tweets neither advice nor endorsement.
TCS S/R for 16/1/24Support and Resistance Levels:
Based on the price action, you have to identify two significant levels: the red line acting as resistance and the green line acting as support. Additionally, there have marked red and green shades to represent resistance and support zones, respectively.
Support: The green line and green shade represent support levels. These levels are where the price tends to find buying interest, preventing it from falling further. Traders can consider these levels as potential buying opportunities.
Resistance: The red line and red shade represent resistance levels. These levels are where the price tends to encounter selling pressure, preventing it from rising further. Traders can consider these levels as potential selling opportunities.
Breakouts: If the price breaks above the resistance zone (red shade) convincingly, it may indicate a bullish breakout, and the price could move higher to the next resistance level. On the other hand, if the price breaks below the support zone (green shade) convincingly, it may indicate a bearish breakout, and the price could move lower to the next support level.
Keltner Channel:
The Keltner Channel is a technical indicator that uses an exponential moving average (EMA) to create an upper and lower channel around the price action. Traders can use this channel to identify potential long and short positions.
Long Position: If the price is above the upper line of the Keltner Channel, it may indicate a potential long opportunity, as it suggests the price is trading above the average range and might continue in an upward trend.
Short Position: If the price is below the lower line of the Keltner Channel, it may indicate a potential short opportunity, as it suggests the price is trading below the average range and might continue in a downward trend.
Disclosure: I am not SEBI registered. I just wanted to let you know that the information provided here is for learning purposes only. Please consult your financial advisor before making any decisions. Tweets neither advice nor endorsement.
TCS TCS is currently moving in range at weekly timeframe for more than 3 years.
TCS has shown a decent performance in recent Q3 result.
TCS Q3 Results Live Updates | Key Highlights of the Quarter Ended December 31, 2023
Revenue at `60,583 crore, +4.0% YoY, +1.7% YoY in Constant Currency
Operating Margin at 25.0%*; an expansion of 0.5% YoY
Net Income at `11,735 crore*, +8.2%* YoY | Net Margin at 19.4%*
Net Cash from Operations at `11,276 crore ie 102% of Net Income
Diverse and inclusive workplace: Women in the workforce: 35.7% | 153 Nationalities
Investing in the workforce: 39.7 million learning hours YTD | 3.7 million competencies YTD
LTM IT Services attrition rate at 13.3%
Dividend per share: ` 27.00, including ₹ 18.00 as special dividend | Record date 19/01/2024 | Payment date 05/02/2024
